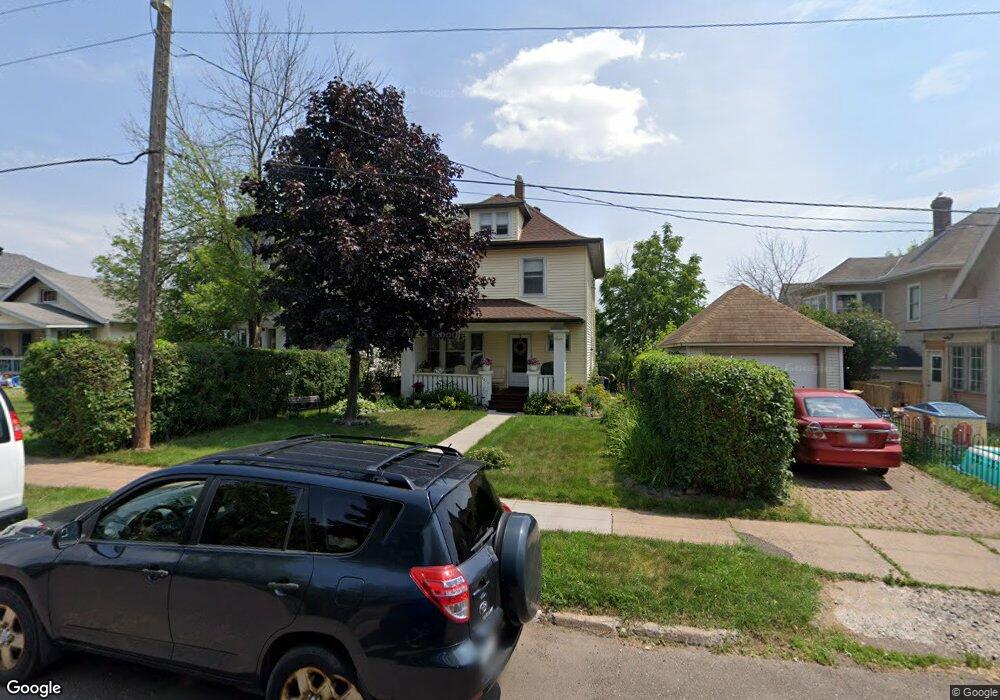
1210 E 8th St Duluth, MN 55805
East Hillside NeighborhoodEstimated Value: $231,000 - $300,000
3
Beds
1
Bath
1,514
Sq Ft
$167/Sq Ft
Est. Value
About This Home
This home is located at 1210 E 8th St, Duluth, MN 55805 and is currently estimated at $253,040, approximately $167 per square foot. 1210 E 8th St is a home located in St. Louis County with nearby schools including Ordean East Middle School, East High School, and Many Rivers Montessori School.
Ownership History
Date
Name
Owned For
Owner Type
Purchase Details
Closed on
Mar 6, 2002
Sold by
Peterman John M
Bought by
Tarnowski Anthony J and Tarnowski Norliza
Current Estimated Value
Home Financials for this Owner
Home Financials are based on the most recent Mortgage that was taken out on this home.
Original Mortgage
$79,900
Interest Rate
6.95%
Mortgage Type
Construction
Create a Home Valuation Report for This Property
The Home Valuation Report is an in-depth analysis detailing your home's value as well as a comparison with similar homes in the area
Home Values in the Area
Average Home Value in this Area
Purchase History
| Date | Buyer | Sale Price | Title Company |
|---|---|---|---|
| Tarnowski Anthony J | $80,000 | -- |
Source: Public Records
Mortgage History
| Date | Status | Borrower | Loan Amount |
|---|---|---|---|
| Closed | Tarnowski Anthony J | $79,900 | |
| Closed | Tarnowski Anthony J | $3,000 |
Source: Public Records
Tax History
| Year | Tax Paid | Tax Assessment Tax Assessment Total Assessment is a certain percentage of the fair market value that is determined by local assessors to be the total taxable value of land and additions on the property. | Land | Improvement |
|---|---|---|---|---|
| 2024 | $3,236 | $256,200 | $17,400 | $238,800 |
| 2023 | $3,236 | $224,000 | $20,800 | $203,200 |
| 2022 | $2,964 | $212,200 | $19,600 | $192,600 |
| 2021 | $2,478 | $171,800 | $19,700 | $152,100 |
| 2020 | $2,414 | $171,800 | $19,700 | $152,100 |
| 2019 | $2,164 | $164,300 | $18,700 | $145,600 |
| 2018 | $1,870 | $151,100 | $18,700 | $132,400 |
| 2017 | $1,736 | $142,400 | $18,100 | $124,300 |
| 2016 | $1,698 | $81,000 | $24,600 | $56,400 |
| 2015 | $1,729 | $109,100 | $17,600 | $91,500 |
| 2014 | $1,729 | $109,100 | $17,600 | $91,500 |
Source: Public Records
Map
Nearby Homes
- 902 N 11th Ave E
- 1027 E 9th St
- 1403 E 8th St
- XXX E Ninth St
- 1011 N 12th Ave E
- 419 N 13th Ave E
- 1023 E 5th St
- 418 N 13th Ave E
- 917 E 7th St
- 1205 E 3rd St
- 719 N 16th Ave E
- 1316 E 2nd St
- 1324 E 2nd St
- 1211 E 1st St
- 845 Grandview Ave
- 908 E Skyline Pkwy
- 619 N 18th Ave E
- 706 E 11th St
- 915 Grandview Ave
- 1426 E 1st St
Your Personal Tour Guide
Ask me questions while you tour the home.