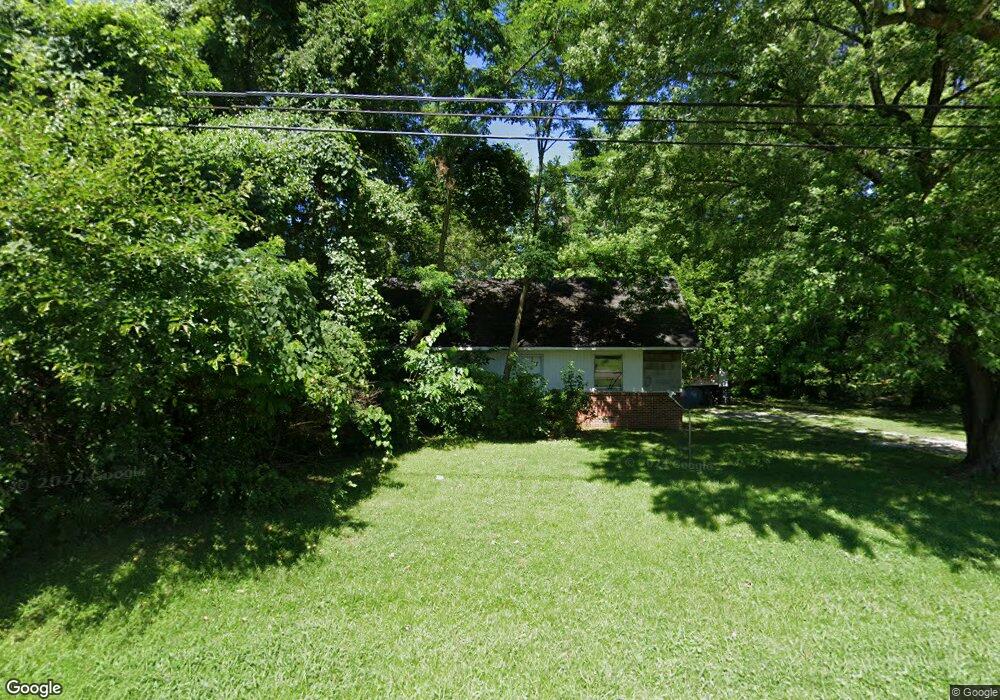
1210 N Clover St Union City, TN 38261
Estimated Value: $99,000 - $145,000
--
Bed
1
Bath
1,720
Sq Ft
$70/Sq Ft
Est. Value
About This Home
This home is located at 1210 N Clover St, Union City, TN 38261 and is currently estimated at $119,925, approximately $69 per square foot. 1210 N Clover St is a home located in Obion County with nearby schools including Union City Elementary School, Union City Middle School, and Union City High School.
Ownership History
Date
Name
Owned For
Owner Type
Purchase Details
Closed on
Jul 8, 2025
Sold by
Obion County Government
Bought by
Bell John and Whitesell Jacqueline
Current Estimated Value
Purchase Details
Closed on
Apr 18, 2025
Sold by
Obion County
Bought by
Obion County Tennessee
Purchase Details
Closed on
Mar 27, 2024
Sold by
Obion County and City Of Union City
Bought by
Antlia Properties Llc and Armstrong
Purchase Details
Closed on
Mar 8, 2024
Sold by
Martinez Luis
Bought by
Martinez Renae
Purchase Details
Closed on
Oct 23, 2013
Sold by
Konkol Joseph
Bought by
Martinez Luis and Martinez Renae
Purchase Details
Closed on
Apr 26, 1995
Sold by
Conn A G
Bought by
Joseph Konkol
Purchase Details
Closed on
Jan 1, 1957
Bought by
Conn Conn A and Conn Nola
Create a Home Valuation Report for This Property
The Home Valuation Report is an in-depth analysis detailing your home's value as well as a comparison with similar homes in the area
Home Values in the Area
Average Home Value in this Area
Purchase History
| Date | Buyer | Sale Price | Title Company |
|---|---|---|---|
| Bell John | $5,000 | None Listed On Document | |
| Bell John | $5,000 | None Listed On Document | |
| Obion County Tennessee | $4,574 | None Listed On Document | |
| Obion County Tennessee | $4,574 | None Listed On Document | |
| Antlia Properties Llc | $28,297 | None Listed On Document | |
| Martinez Renae | -- | None Listed On Document | |
| Martinez Luis | -- | -- | |
| Joseph Konkol | $38,000 | -- | |
| Joseph Konkol | $38,000 | -- | |
| Conn Conn A | -- | -- |
Source: Public Records
Tax History Compared to Growth
Tax History
| Year | Tax Paid | Tax Assessment Tax Assessment Total Assessment is a certain percentage of the fair market value that is determined by local assessors to be the total taxable value of land and additions on the property. | Land | Improvement |
|---|---|---|---|---|
| 2025 | -- | $20,350 | $0 | $0 |
| 2024 | -- | $20,575 | $1,800 | $18,775 |
| 2023 | $577 | $20,575 | $1,800 | $18,775 |
| 2022 | $202 | $12,650 | $1,850 | $10,800 |
| 2021 | $198 | $12,650 | $1,850 | $10,800 |
| 2020 | $202 | $12,650 | $1,850 | $10,800 |
| 2019 | $456 | $12,650 | $1,850 | $10,800 |
| 2018 | $453 | $12,250 | $1,850 | $10,400 |
| 2017 | $448 | $11,775 | $1,850 | $9,925 |
| 2016 | $448 | $11,775 | $1,850 | $9,925 |
| 2015 | $446 | $11,775 | $1,850 | $9,925 |
| 2014 | $446 | $11,775 | $1,850 | $9,925 |
Source: Public Records
Map
Nearby Homes
- 1009 E Cheatham St
- 841 Mosswood Dr
- 0 Mosswood Dr Unit RRA45928
- 0 Mosswood Dr Unit 44704
- 1414 Forest Dr
- 922 N Division St
- 903 Sherwood Dr
- 724 E Martin Luther King
- 1449 Forest Dr
- 501 N 1st St
- 803 E Main St
- 817 Exchange St
- 1813 E Vine St
- 610 Perkins St
- 616 S 3rd St
- 901 S Home St
- 42 Wilma Dr Unit Lot 42
- 38 Wilma Dr Unit Lot 38
- 49 Wilma Dr Unit Lot 49
- 39 Wilma Dr Unit Lot 39
- 1300 N Clover St
- 1209 N Clover St
- 902 Jordan Street Terrace
- 906 Jordan Terrace
- 906 Jordon Terrace
- 906 Jordan Street Terrace
- 909 Jordan Street Terrace
- 1105 N Clover St
- 910 Jordan Street Terrace
- 1309 N Clover St
- 1320 N Clover St
- 914 Jordan Street Terrace
- 1313 N Clover St
- 916 Jordan Street Terrace
- 820 E Todd St
- 1317 N Clover St
- 816 E Todd St
- 1002 Jordan Street Terrace
- 1002 N Clover St
- 1325 N Clover St