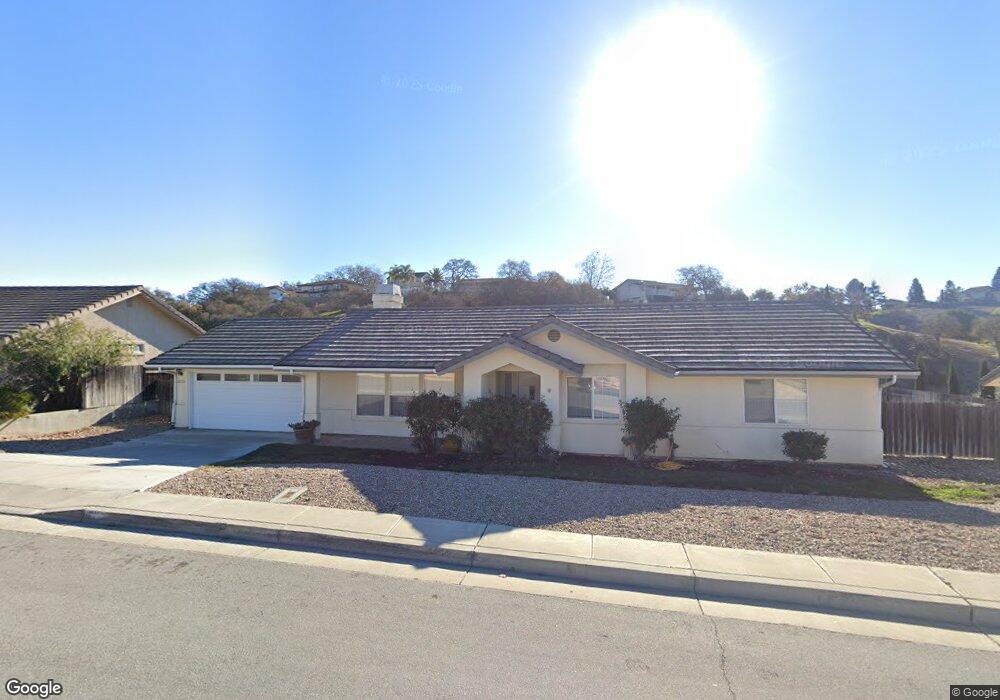
1210 Windsong Way Paso Robles, CA 93446
Estimated Value: $671,000 - $772,000
3
Beds
2
Baths
1,345
Sq Ft
$530/Sq Ft
Est. Value
About This Home
This home is located at 1210 Windsong Way, Paso Robles, CA 93446 and is currently estimated at $713,492, approximately $530 per square foot. 1210 Windsong Way is a home located in San Luis Obispo County with nearby schools including Glen Speck Elementary School, George H. Flamson Middle School, and Paso Robles High School.
Ownership History
Date
Name
Owned For
Owner Type
Purchase Details
Closed on
Dec 22, 2011
Sold by
Robasciotti John E and Robasciotti Linda M
Bought by
Robasciotti John E and Robasciotti Linda M
Current Estimated Value
Purchase Details
Closed on
Feb 14, 2003
Sold by
Robasciotti John Edward
Bought by
Robasciotti Linda Murphy
Purchase Details
Closed on
Feb 13, 2003
Sold by
Anderson Sammie L and Anderson Cassandra D
Bought by
Robasciotti Linda Murphy
Purchase Details
Closed on
Nov 12, 1997
Sold by
Charnley Andrew
Bought by
Anderson Sammie L and Anderson Cassandra D
Home Financials for this Owner
Home Financials are based on the most recent Mortgage that was taken out on this home.
Original Mortgage
$121,500
Interest Rate
7.13%
Create a Home Valuation Report for This Property
The Home Valuation Report is an in-depth analysis detailing your home's value as well as a comparison with similar homes in the area
Home Values in the Area
Average Home Value in this Area
Purchase History
| Date | Buyer | Sale Price | Title Company |
|---|---|---|---|
| Robasciotti John E | -- | None Available | |
| Robasciotti John E | -- | None Available | |
| Robasciotti Linda Murphy | -- | Fidelity Title Company | |
| Robasciotti Linda Murphy | $299,500 | Fidelity Title Company | |
| Anderson Sammie L | $135,000 | Fidelity National Title Co |
Source: Public Records
Mortgage History
| Date | Status | Borrower | Loan Amount |
|---|---|---|---|
| Previous Owner | Anderson Sammie L | $121,500 |
Source: Public Records
Tax History Compared to Growth
Tax History
| Year | Tax Paid | Tax Assessment Tax Assessment Total Assessment is a certain percentage of the fair market value that is determined by local assessors to be the total taxable value of land and additions on the property. | Land | Improvement |
|---|---|---|---|---|
| 2025 | $4,848 | $433,752 | $202,754 | $230,998 |
| 2024 | $4,771 | $425,248 | $198,779 | $226,469 |
| 2023 | $4,771 | $416,911 | $194,882 | $222,029 |
| 2022 | $4,702 | $408,737 | $191,061 | $217,676 |
| 2021 | $4,623 | $400,723 | $187,315 | $213,408 |
| 2020 | $4,562 | $396,615 | $185,395 | $211,220 |
| 2019 | $4,499 | $388,839 | $181,760 | $207,079 |
| 2018 | $4,440 | $381,216 | $178,197 | $203,019 |
| 2017 | $4,182 | $373,742 | $174,703 | $199,039 |
| 2016 | $4,102 | $366,415 | $171,278 | $195,137 |
| 2015 | $4,089 | $360,912 | $168,706 | $192,206 |
| 2014 | $3,802 | $340,000 | $160,000 | $180,000 |
Source: Public Records
Map
Nearby Homes
- 616 Jackson Dr
- 430 Montebello Oaks Dr
- 1766 Union Rd
- 925 Osos Way
- 112 El Dorado Ct
- 0 Orchard Dr
- 726 N Trigo Ln
- 1551 Las Brisas Dr
- 533 Ferro Ln
- 821 Marlbank Place
- 833 Rolling Hills Rd Unit 16
- 2050 Prospect Ave
- 420 Creston Rd
- 845 Creston Rd
- 715 Orchard Dr
- 107 Capitol Hill Dr
- 2450 Golden Hill Rd
- 959 Vista Cerro Dr
- 1226 Kapareil Ln
- 594 Red Cloud Rd
- 1212 Windsong Way
- 1208 Windsong Way
- 1209 Windsong Way
- 1211 Windsong Way
- 1214 Windsong Way
- 1207 Windsong Way
- 1206 Windsong Way
- 1205 Windsong Way
- 1213 Windsong Way
- 1216 Windsong Way
- 1217 Mariah Ln
- 1204 Windsong Way
- 1218 Mariah Ln
- 1203 Windsong Way
- 1215 Windsong Way
- 0 Kleck Rd
- 2 Kleck Rd
- 1 Kleck Rd
- 713 Renate Way
- 1218 Windsong Way