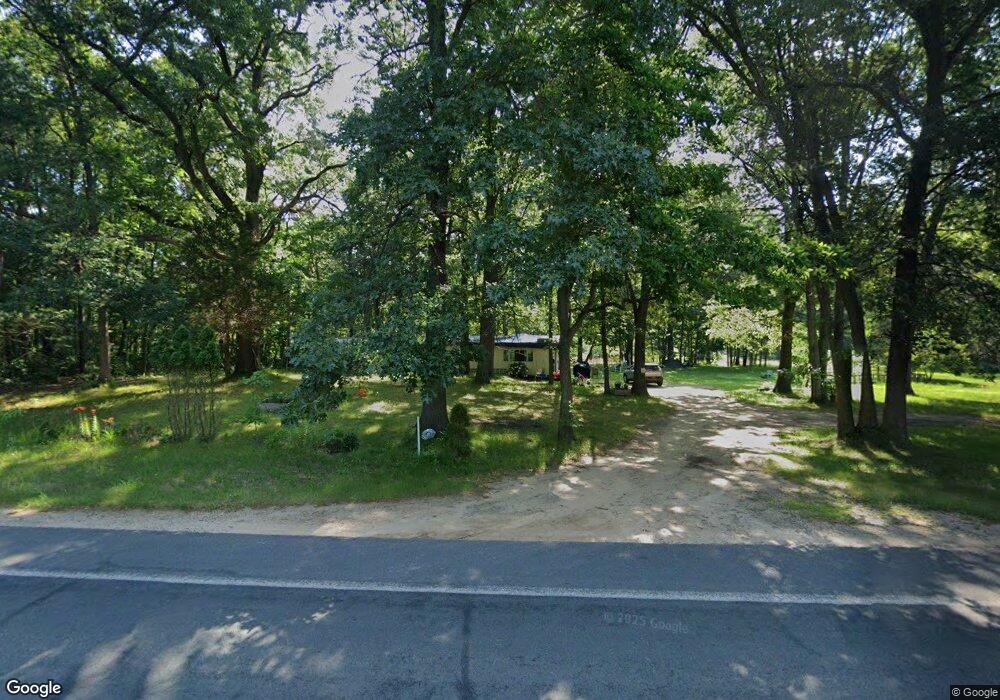
1211 56th St Fennville, MI 49408
Estimated Value: $96,000 - $228,000
3
Beds
1
Bath
680
Sq Ft
$211/Sq Ft
Est. Value
About This Home
This home is located at 1211 56th St, Fennville, MI 49408 and is currently estimated at $143,166, approximately $210 per square foot. 1211 56th St is a home located in Allegan County with nearby schools including Fennville Elementary School, Fennville Middle School, and Fennville High School.
Ownership History
Date
Name
Owned For
Owner Type
Purchase Details
Closed on
Jan 17, 2020
Sold by
Luna Edgar Ibon
Bought by
Cook David
Current Estimated Value
Purchase Details
Closed on
Jan 11, 2020
Sold by
Sanchez Gilberto
Bought by
Luna Edgar Ibon
Purchase Details
Closed on
Nov 18, 2014
Sold by
King Veronica
Bought by
Sanchez Gilberto
Purchase Details
Closed on
Aug 3, 2005
Sold by
Frank Martin R and Velez Mary
Bought by
King Veronica
Purchase Details
Closed on
Sep 12, 2003
Sold by
Shannon Eugene and Gye Shannon May
Bought by
Frank Martin R and Velez Mary
Create a Home Valuation Report for This Property
The Home Valuation Report is an in-depth analysis detailing your home's value as well as a comparison with similar homes in the area
Home Values in the Area
Average Home Value in this Area
Purchase History
| Date | Buyer | Sale Price | Title Company |
|---|---|---|---|
| Cook David | -- | None Available | |
| Luna Edgar Ibon | -- | None Available | |
| Sanchez Gilberto | -- | None Available | |
| King Veronica | -- | Metropolitan Title Company | |
| Frank Martin R | $25,000 | Chicago Title |
Source: Public Records
Tax History Compared to Growth
Tax History
| Year | Tax Paid | Tax Assessment Tax Assessment Total Assessment is a certain percentage of the fair market value that is determined by local assessors to be the total taxable value of land and additions on the property. | Land | Improvement |
|---|---|---|---|---|
| 2025 | $1,099 | $46,800 | $21,500 | $25,300 |
| 2024 | $974 | $39,700 | $19,600 | $20,100 |
| 2023 | $974 | $34,100 | $16,000 | $18,100 |
| 2022 | $974 | $32,400 | $14,600 | $17,800 |
| 2021 | $0 | $29,900 | $13,300 | $16,600 |
| 2020 | $0 | $27,900 | $12,600 | $15,300 |
| 2019 | $0 | $22,600 | $11,400 | $11,200 |
| 2018 | $0 | $22,700 | $11,400 | $11,300 |
| 2017 | $0 | $20,900 | $10,500 | $10,400 |
| 2016 | $0 | $17,700 | $9,500 | $8,200 |
| 2015 | -- | $17,700 | $9,500 | $8,200 |
| 2014 | -- | $16,400 | $8,700 | $7,700 |
| 2013 | -- | $15,800 | $8,700 | $7,100 |
Source: Public Records
Map
Nearby Homes