
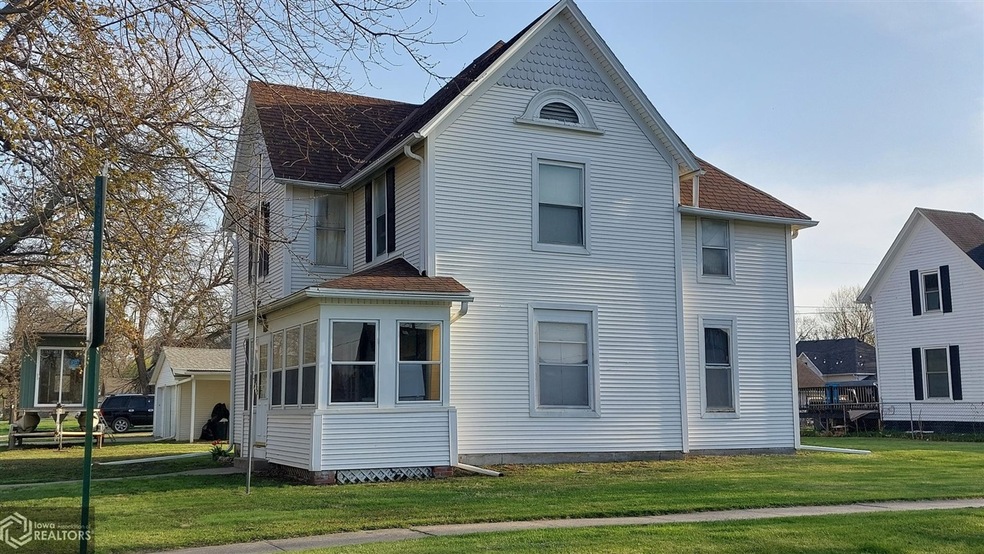

1211 N 4th St Red Oak, IA 51566
Estimated Value: $78,000 - $118,698
4
Beds
2
Baths
2,004
Sq Ft
$49/Sq Ft
Est. Value
Highlights
- Main Floor Bedroom
- Porch
- Forced Air Heating and Cooling System
- No HOA
- Living Room
- Dining Room
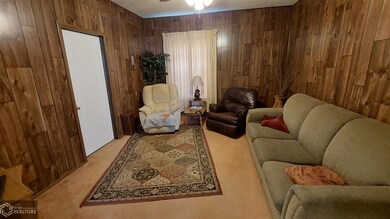
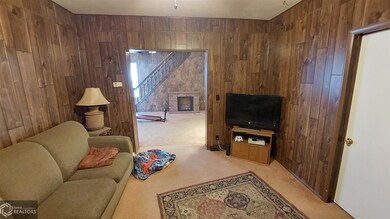
About This Home
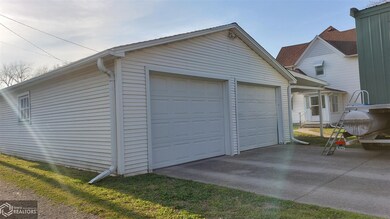
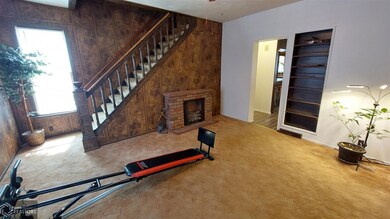
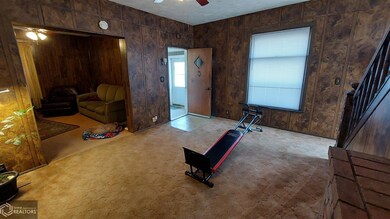
As of May 2022Come take a look at this attractive 2 story turn of the century home. It is located on a corner lot, has a nice sized garage and additional carport in back. Also this home has been 90% drywalled with the plaster removed. Make your appointment today to view this home.
Home Details
Home Type
- Single Family
Est. Annual Taxes
- $1,372
Year Built
- Built in 1900
Lot Details
- 0.25 Acre Lot
- Lot Dimensions are 125 x 87
Home Design
- Vinyl Siding
Interior Spaces
- 2,004 Sq Ft Home
- 2-Story Property
- Family Room
- Living Room
- Dining Room
- Unfinished Basement
- Partial Basement
Bedrooms and Bathrooms
- 4 Bedrooms
- Main Floor Bedroom
Parking
- 2 Car Garage
- Carport
Additional Features
- Porch
- Forced Air Heating and Cooling System
Community Details
- No Home Owners Association
Similar Homes in Red Oak, IA
Create a Home Valuation Report for This Property
The Home Valuation Report is an in-depth analysis detailing your home's value as well as a comparison with similar homes in the area
Home Values in the Area
Average Home Value in this Area
Mortgage History
| Date | Status | Borrower | Loan Amount |
|---|---|---|---|
| Closed | Vanhouten Bryce | $27,000 |
Source: Public Records
Property History
| Date | Event | Price | Change | Sq Ft Price |
|---|---|---|---|---|
| 05/26/2022 05/26/22 | Sold | $74,000 | -1.3% | $37 / Sq Ft |
| 05/01/2022 05/01/22 | Pending | -- | -- | -- |
| 04/22/2022 04/22/22 | For Sale | $75,000 | +167.9% | $37 / Sq Ft |
| 04/12/2013 04/12/13 | Sold | $28,000 | -12.5% | $14 / Sq Ft |
| 03/22/2013 03/22/13 | Pending | -- | -- | -- |
| 03/14/2013 03/14/13 | For Sale | $32,000 | +45.5% | $16 / Sq Ft |
| 06/29/2012 06/29/12 | Sold | $22,000 | -60.0% | $11 / Sq Ft |
| 05/30/2012 05/30/12 | Pending | -- | -- | -- |
| 04/02/2012 04/02/12 | For Sale | $55,000 | -- | $27 / Sq Ft |
Source: NoCoast MLS
Tax History Compared to Growth
Tax History
| Year | Tax Paid | Tax Assessment Tax Assessment Total Assessment is a certain percentage of the fair market value that is determined by local assessors to be the total taxable value of land and additions on the property. | Land | Improvement |
|---|---|---|---|---|
| 2024 | $1,668 | $74,020 | $8,800 | $65,220 |
| 2023 | $1,464 | $74,020 | $8,800 | $65,220 |
| 2022 | $1,376 | $54,310 | $8,800 | $45,510 |
| 2021 | $1,372 | $54,310 | $8,800 | $45,510 |
| 2020 | $1,372 | $51,470 | $8,800 | $42,670 |
| 2019 | $1,504 | $51,470 | $8,800 | $42,670 |
| 2018 | $1,446 | $57,150 | $0 | $0 |
| 2017 | $1,408 | $57,150 | $0 | $0 |
| 2015 | $1,368 | $57,150 | $0 | $0 |
| 2014 | $1,676 | $67,720 | $0 | $0 |
Source: Public Records
Agents Affiliated with this Home
-
Dan Bullington
Seller's Agent in 2022
Dan Bullington
Your Real Estate Choice Inc
(712) 621-4999
189 Total Sales
Map
Source: NoCoast MLS
MLS Number: NOC6182497
APN: 600-62-81-080050-00
Disclaimer: Certain information contained herein is derived from information provided by parties other than Homes.com. All information provided is deemed reliable, but is not guaranteed to be accurate and should be independently verified.
![]() IDX information is provided exclusively for personal, non-commercial use, and may not be used for any purpose other than to identify prospective properties consumers may be interested in purchasing.
IDX information is provided exclusively for personal, non-commercial use, and may not be used for any purpose other than to identify prospective properties consumers may be interested in purchasing.
Information is deemed reliable but not guaranteed.
Nearby Homes