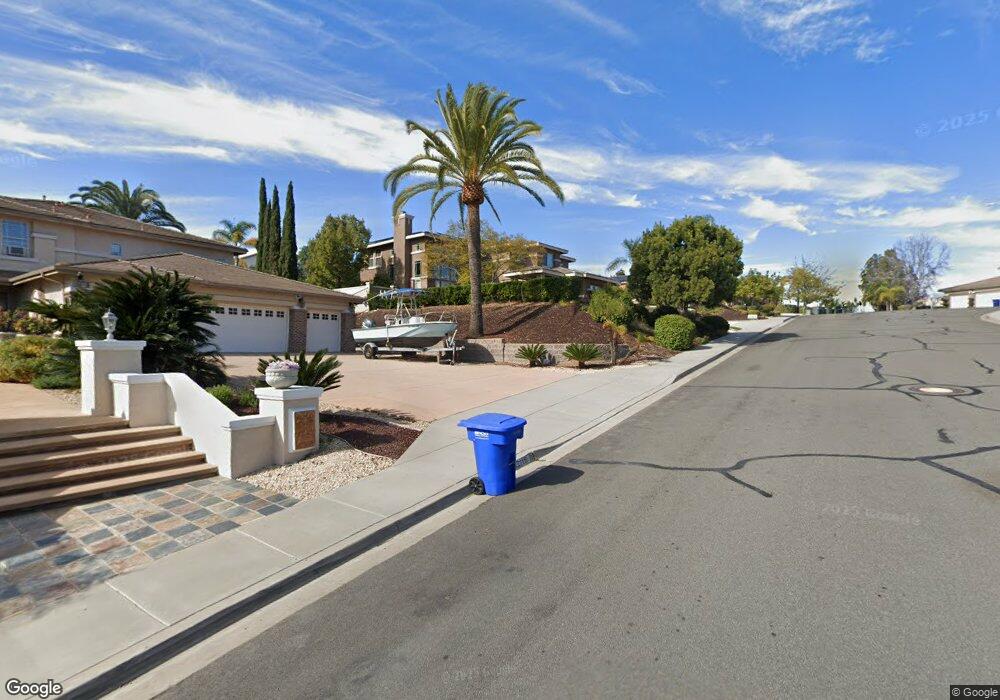
12113 Travertine Ct Poway, CA 92064
Miramar Ranch North NeighborhoodEstimated Value: $2,058,000 - $2,417,000
5
Beds
5
Baths
3,872
Sq Ft
$588/Sq Ft
Est. Value
About This Home
This home is located at 12113 Travertine Ct, Poway, CA 92064 and is currently estimated at $2,278,404, approximately $588 per square foot. 12113 Travertine Ct is a home located in San Diego County with nearby schools including Creekside Elementary, Meadowbrook Middle, and Poway High.
Ownership History
Date
Name
Owned For
Owner Type
Purchase Details
Closed on
Mar 13, 2024
Sold by
Xalachastra Family Trust and Bybee Peter B
Bought by
Snowcreek Properties Llc
Current Estimated Value
Purchase Details
Closed on
Nov 30, 2011
Sold by
Bybee Peter B and Bybee Gayle K
Bought by
Bybee Peter B and Bybee Gayle K
Home Financials for this Owner
Home Financials are based on the most recent Mortgage that was taken out on this home.
Original Mortgage
$280,000
Interest Rate
4.06%
Mortgage Type
New Conventional
Purchase Details
Closed on
Jun 8, 2000
Sold by
Bybee Peter B and Bybee Gayle K
Bought by
Bybee Peter B and Bybee Gayle K
Purchase Details
Closed on
Jan 26, 1998
Sold by
Shea Homes Ltd Partnership
Bought by
Bybee Peter B and Bybee Gayle K
Home Financials for this Owner
Home Financials are based on the most recent Mortgage that was taken out on this home.
Original Mortgage
$390,000
Interest Rate
7.05%
Create a Home Valuation Report for This Property
The Home Valuation Report is an in-depth analysis detailing your home's value as well as a comparison with similar homes in the area
Home Values in the Area
Average Home Value in this Area
Purchase History
| Date | Buyer | Sale Price | Title Company |
|---|---|---|---|
| Snowcreek Properties Llc | -- | None Listed On Document | |
| Bybee Peter B | -- | First American Title Company | |
| Bybee Peter B | -- | First American Title Company | |
| Bybee Peter B | -- | -- | |
| Bybee Peter B | $545,000 | Lawyers Title Company |
Source: Public Records
Mortgage History
| Date | Status | Borrower | Loan Amount |
|---|---|---|---|
| Previous Owner | Bybee Peter B | $280,000 | |
| Previous Owner | Bybee Peter B | $390,000 |
Source: Public Records
Tax History
| Year | Tax Paid | Tax Assessment Tax Assessment Total Assessment is a certain percentage of the fair market value that is determined by local assessors to be the total taxable value of land and additions on the property. | Land | Improvement |
|---|---|---|---|---|
| 2025 | $10,366 | $915,203 | $239,503 | $675,700 |
| 2024 | $10,366 | $897,258 | $234,807 | $662,451 |
| 2023 | $10,074 | $879,665 | $230,203 | $649,462 |
| 2022 | $9,909 | $862,418 | $225,690 | $636,728 |
| 2021 | $9,782 | $845,509 | $221,265 | $624,244 |
| 2020 | $9,653 | $836,841 | $218,997 | $617,844 |
| 2019 | $9,407 | $820,433 | $214,703 | $605,730 |
| 2018 | $9,148 | $804,347 | $210,494 | $593,853 |
| 2017 | $8,909 | $788,576 | $206,367 | $582,209 |
| 2016 | $8,731 | $773,115 | $202,321 | $570,794 |
| 2015 | $8,604 | $761,503 | $199,282 | $562,221 |
| 2014 | $8,406 | $746,587 | $195,379 | $551,208 |
Source: Public Records
Map
Nearby Homes
- 12204 Pepper Tree Ln Unit 31
- 11558 Creek Rd
- 11815 Cypress Valley Dr Unit 1
- 11393 Vista Elevada
- 10884 Caminito Colorado
- 12820 Hideaway Ln
- 12357 Caminito Peral
- 12545 Buckskin Trail
- 12030 Redcliff Ct
- 12204 Briar Knoll Way
- 11495 Larmier Cir
- 12811 Beeler Creek Trail
- 12608 Tustin St
- 10776 Birch Bluff Ave
- 10747 Birch Bluff Ave
- 10737 Birch Bluff Ave
- 12665 Oak Knoll Rd
- 12701 Oak Knoll Rd
- 12709 Oak Knoll Rd
- 0 Dorathea Terrace
- 12107 Travertine Ct
- 12119 Travertine Ct
- 12283 Porcelina Ct
- 12293 Porcelina Ct
- 12101 Travertine Ct
- 12125 Travertine Ct
- 12271 Porcelina Ct
- 12292 Porcelina Ct
- 12112 Travertine Ct
- 12265 Porcelina Ct
- 12280 Misty Blue Ct
- 12106 Travertine Ct
- 12290 Misty Blue Ct
- 12100 Travertine Ct
- 12131 Travertine Ct
- 12259 Porcelina Ct
- 12282 Porcelina Ct
- 12295 Misty Blue Ct
- 12130 Travertine Ct
- 12270 Porcelina Ct
Your Personal Tour Guide
Ask me questions while you tour the home.