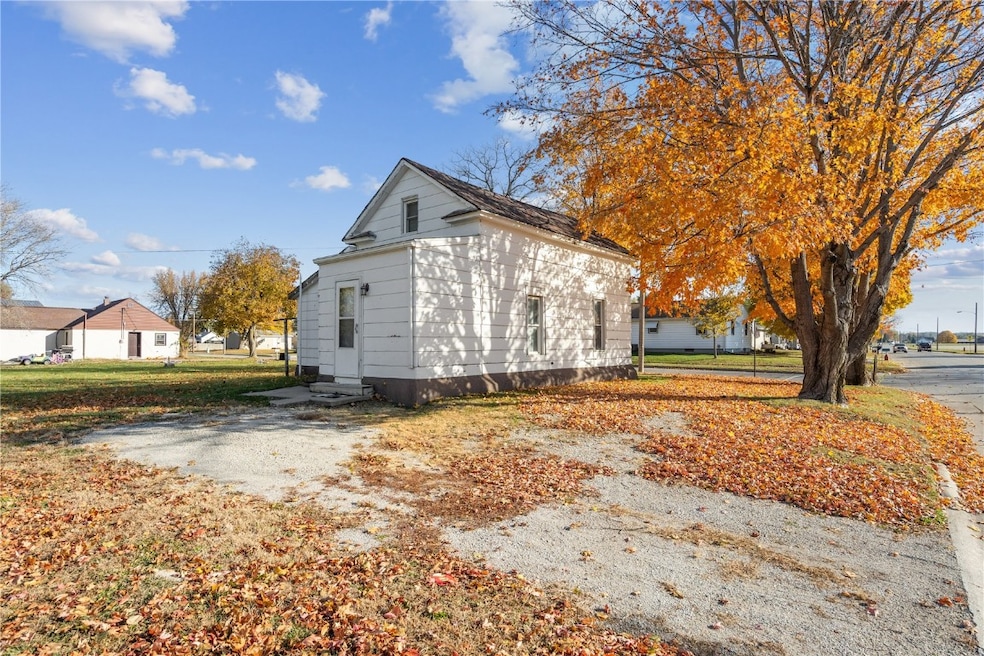
1215 5th Ave Vinton, IA 52349
Estimated payment $409/month
Highlights
- Main Floor Primary Bedroom
- Living Room
- Forced Air Heating System
- Eat-In Kitchen
- Shed
- Family Room
About This Home
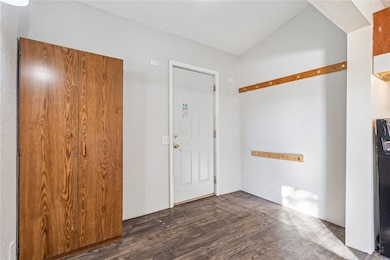
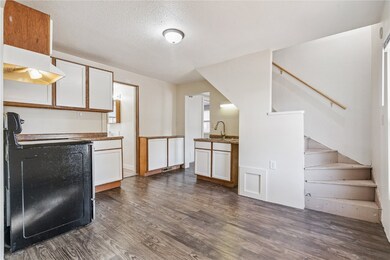
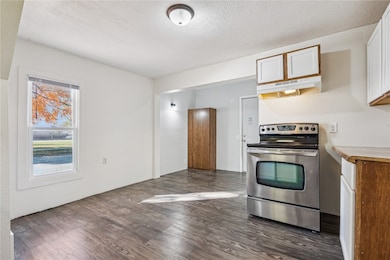
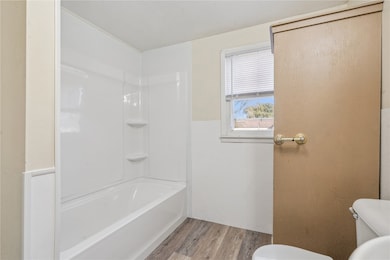
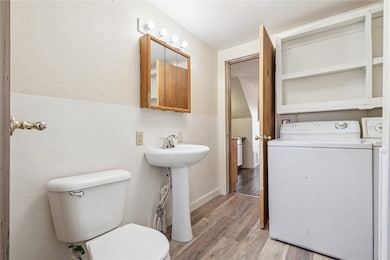
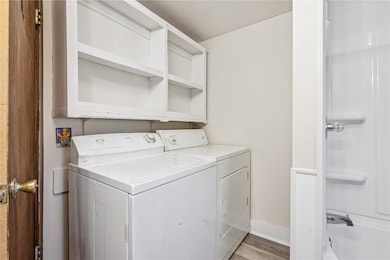
This is it! Whether it’s your first home, a fresh start, or your next investment, this property offers it all. Inside, you’ll find a bright, move-in-ready space with fresh paint, new flooring, some newer windows, and an updated bath. Enjoy the ease of main floor laundry—all appliances stay, including washer and dryer! The spacious upstairs bedroom could even serve as two rooms. The partial basement, accessible from outside, offers a practical area for shelter. While the exterior is ready for your improvements, it’s a great opportunity to add instant equity. A handy storage shed is perfect for garden tools. Conveniently located across from the elementary school, near Anderson Park, and just steps from Nathan’s Glow-in-the-Dark Trail.
Home Details
Home Type
- Single Family
Est. Annual Taxes
- $966
Year Built
- Built in 1880
Lot Details
- 8,712 Sq Ft Lot
- Lot Dimensions are 66' x 132
Parking
- Off-Street Parking
Home Design
- Frame Construction
- Siding
Interior Spaces
- 811 Sq Ft Home
- 1.5-Story Property
- Family Room
- Living Room
- Partial Basement
Kitchen
- Eat-In Kitchen
- Range
Bedrooms and Bathrooms
- 2 Bedrooms
- Primary Bedroom on Main
- 1 Full Bathroom
Laundry
- Dryer
- Washer
Outdoor Features
- Shed
Schools
- Tilford Elementary School
- Vinton/Shellsburg Middle School
- Vinton/Shellsburg High School
Utilities
- Forced Air Heating System
- Heating System Uses Gas
- Gas Water Heater
Listing and Financial Details
- Assessor Parcel Number 24076025
Map
Home Values in the Area
Average Home Value in this Area
Tax History
| Year | Tax Paid | Tax Assessment Tax Assessment Total Assessment is a certain percentage of the fair market value that is determined by local assessors to be the total taxable value of land and additions on the property. | Land | Improvement |
|---|---|---|---|---|
| 2025 | $966 | $55,800 | $18,500 | $37,300 |
| 2024 | $966 | $51,500 | $18,200 | $33,300 |
| 2023 | $900 | $51,500 | $18,200 | $33,300 |
| 2022 | $924 | $41,800 | $14,500 | $27,300 |
| 2021 | $924 | $41,800 | $14,500 | $27,300 |
| 2020 | $980 | $45,300 | $9,900 | $35,400 |
| 2019 | $940 | $45,300 | $9,900 | $35,400 |
| 2018 | $914 | $42,900 | $9,200 | $33,700 |
| 2017 | $914 | $42,900 | $9,200 | $33,700 |
| 2016 | $866 | $40,100 | $8,600 | $31,500 |
| 2015 | $866 | $40,100 | $8,600 | $31,500 |
| 2014 | $886 | $41,000 | $0 | $0 |
Property History
| Date | Event | Price | List to Sale | Price per Sq Ft |
|---|---|---|---|---|
| 11/24/2025 11/24/25 | Pending | -- | -- | -- |
| 11/06/2025 11/06/25 | For Sale | $62,500 | -- | $77 / Sq Ft |
Purchase History
| Date | Type | Sale Price | Title Company |
|---|---|---|---|
| Warranty Deed | $540,500 | None Available | |
| Quit Claim Deed | -- | None Available |
Mortgage History
| Date | Status | Loan Amount | Loan Type |
|---|---|---|---|
| Open | $450,000 | Future Advance Clause Open End Mortgage |
Source: Cedar Rapids Area Association of REALTORS®
MLS Number: 2509171
APN: 24076025
Disclaimer: Certain information contained herein is derived from information provided by parties other than Homes.com. All information provided is deemed reliable, but is not guaranteed to be accurate and should be independently verified.
![]() IDX information is provided exclusively for personal, non-commercial use, and may not be used for any purpose other than to identify prospective properties consumers may be interested in purchasing.
IDX information is provided exclusively for personal, non-commercial use, and may not be used for any purpose other than to identify prospective properties consumers may be interested in purchasing.
Information is deemed reliable but not guaranteed.
