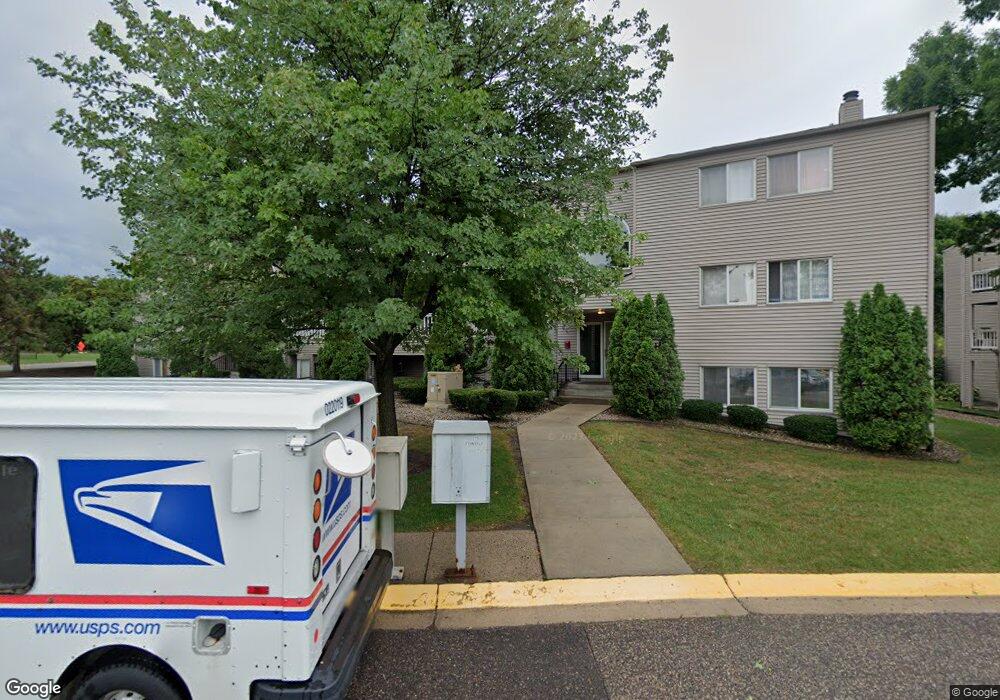
1215 Ferndale St N Unit A15 Saint Paul, MN 55119
Beaver Lake NeighborhoodEstimated Value: $129,696 - $147,000
2
Beds
1
Bath
807
Sq Ft
$173/Sq Ft
Est. Value
About This Home
This home is located at 1215 Ferndale St N Unit A15, Saint Paul, MN 55119 and is currently estimated at $139,674, approximately $173 per square foot. 1215 Ferndale St N Unit A15 is a home located in Ramsey County with nearby schools including Justice Alan Page Elementary, Tartan Senior High School, and Achieve Language Academy.
Ownership History
Date
Name
Owned For
Owner Type
Purchase Details
Closed on
Oct 8, 2021
Sold by
Leuer Christopher J and Leuer Jennifer Marie
Bought by
Martens Joshua
Current Estimated Value
Home Financials for this Owner
Home Financials are based on the most recent Mortgage that was taken out on this home.
Original Mortgage
$188,000
Outstanding Balance
$171,438
Interest Rate
2.8%
Mortgage Type
New Conventional
Estimated Equity
-$31,764
Purchase Details
Closed on
Apr 13, 2015
Sold by
Leuer Christopher J and Leuer Jennifer Marie
Bought by
Leuer Christopher J and Leuer Jennifer Marie
Home Financials for this Owner
Home Financials are based on the most recent Mortgage that was taken out on this home.
Original Mortgage
$97,560
Interest Rate
3.73%
Mortgage Type
New Conventional
Purchase Details
Closed on
Apr 19, 1996
Sold by
Gervais Kenneth
Bought by
Gervais Amanda R
Create a Home Valuation Report for This Property
The Home Valuation Report is an in-depth analysis detailing your home's value as well as a comparison with similar homes in the area
Home Values in the Area
Average Home Value in this Area
Purchase History
| Date | Buyer | Sale Price | Title Company |
|---|---|---|---|
| Martens Joshua | $130,000 | Watermark Title Agency | |
| Leuer Christopher J | $515 | Liberty Title Inc | |
| Gervais Amanda R | $6,000 | -- |
Source: Public Records
Mortgage History
| Date | Status | Borrower | Loan Amount |
|---|---|---|---|
| Open | Martens Joshua | $188,000 | |
| Previous Owner | Leuer Christopher J | $97,560 |
Source: Public Records
Tax History Compared to Growth
Tax History
| Year | Tax Paid | Tax Assessment Tax Assessment Total Assessment is a certain percentage of the fair market value that is determined by local assessors to be the total taxable value of land and additions on the property. | Land | Improvement |
|---|---|---|---|---|
| 2025 | $1,806 | $126,500 | $1,000 | $125,500 |
| 2023 | $1,806 | $126,500 | $1,000 | $125,500 |
| 2022 | $1,580 | $118,100 | $1,000 | $117,100 |
| 2021 | $1,560 | $104,900 | $1,000 | $103,900 |
| 2020 | $1,568 | $100,700 | $1,000 | $99,700 |
| 2019 | $1,300 | $92,700 | $1,000 | $91,700 |
| 2018 | $1,108 | $83,500 | $1,000 | $82,500 |
| 2017 | $1,100 | $69,100 | $1,000 | $68,100 |
| 2016 | $996 | $0 | $0 | $0 |
| 2015 | $812 | $59,000 | $8,800 | $50,200 |
| 2014 | -- | $0 | $0 | $0 |
Source: Public Records
Map
Nearby Homes
- 1252 Farrell St N
- 1231 Deerfield Dr
- 2460 E Elkhart E
- 1323 Pine Tree Dr
- 2253 Geneva Ave N
- 1367 Birchview Dr
- 1374 Birchview Dr
- 2401 Bison Dr
- 2665 Benlana Ct
- 935 Ferndale St N Unit 210
- 935 Ferndale St N Unit 302
- 2317 Arlington Ave E
- 1250 Mcknight Rd N
- 2590 Glenbrook Ave N
- 6297 15th St N
- 6510 23rd St N
- 6551 22nd St N
- 2249 Case Ave E
- 1383 Granada Trail N
- 2056 Gresham Ave N
- 1215 Ferndale St N Unit A8
- 1215 Ferndale St N Unit 17A
- 1215 Ferndale St N Unit A3
- 1215 Ferndale St N Unit 16
- 1215 Ferndale St N Unit A6
- 1215 Ferndale St N Unit A5
- 1215 Ferndale St N Unit A19
- 1215 Ferndale St N Unit 20A
- 1215 Ferndale St N Unit 10A
- 1215 Ferndale St N Unit A7
- 1215 Ferndale St N Unit 18A
- 1215 Ferndale St N Unit A14
- 1215 Ferndale St N Unit A13
- 1215 Ferndale St N Unit A11
- 1215 Ferndale St N Unit A9
- 1215 Ferndale St N Unit A4
- 1215 Ferndale St N Unit A2
- 1215 Ferndale St N Unit A1
- 1215 Ferndale St N Unit A18
- 1215 Ferndale St N Unit 4