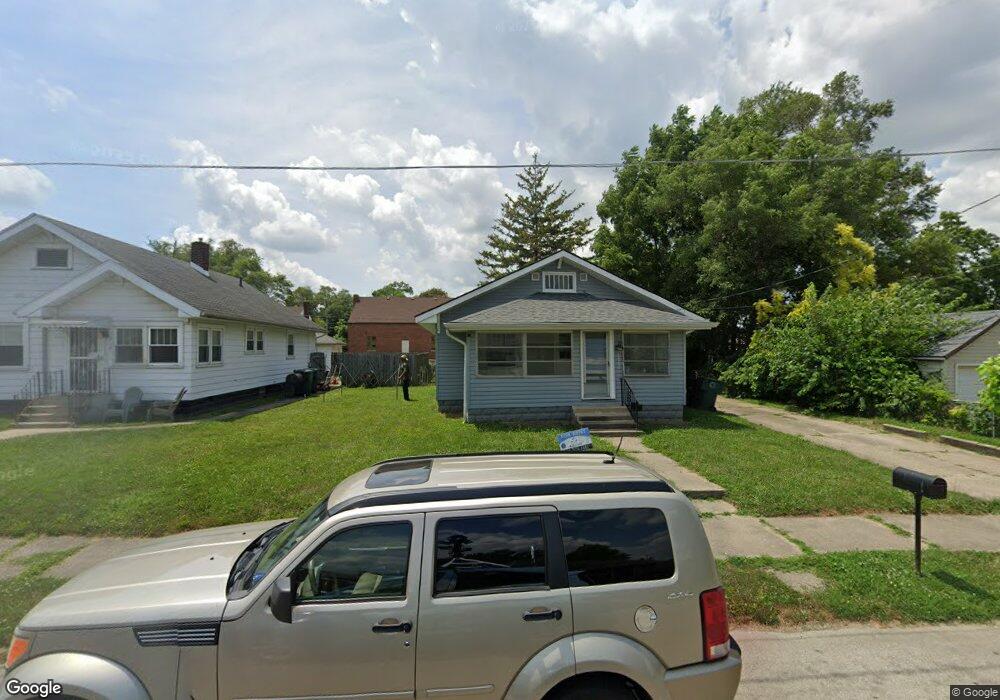
1215 S Ebright St Muncie, IN 47302
Industry NeighborhoodEstimated Value: $69,000 - $84,000
2
Beds
1
Bath
984
Sq Ft
$77/Sq Ft
Est. Value
About This Home
This home is located at 1215 S Ebright St, Muncie, IN 47302 and is currently estimated at $75,473, approximately $76 per square foot. 1215 S Ebright St is a home located in Delaware County with nearby schools including South View Elementary School, Muncie Central High School, and Southside Middle School.
Ownership History
Date
Name
Owned For
Owner Type
Purchase Details
Closed on
Oct 12, 2022
Sold by
Stone Cody
Bought by
208 Wealth Builders Llc
Current Estimated Value
Purchase Details
Closed on
Aug 17, 2022
Sold by
208 Wealth Builders Llc
Bought by
Stone Cody
Purchase Details
Closed on
Nov 22, 2021
Sold by
208 Home Buyers Llc
Bought by
208 Wealth Builders Llc
Purchase Details
Closed on
Oct 6, 2021
Sold by
Wilson Paper Llc
Bought by
208 Home Buyers Llc
Purchase Details
Closed on
Jun 23, 2010
Sold by
Federal National Mortgage Association
Bought by
Shoestring Group Inc
Purchase Details
Closed on
Apr 14, 2010
Sold by
Anderson Ora Lee and Walker Tammy L
Bought by
Federal National Mortgage Association
Create a Home Valuation Report for This Property
The Home Valuation Report is an in-depth analysis detailing your home's value as well as a comparison with similar homes in the area
Home Values in the Area
Average Home Value in this Area
Purchase History
| Date | Buyer | Sale Price | Title Company |
|---|---|---|---|
| 208 Wealth Builders Llc | -- | None Listed On Document | |
| Stone Cody | -- | None Listed On Document | |
| 208 Wealth Builders Llc | -- | None Available | |
| 208 Home Buyers Llc | -- | None Listed On Document | |
| Shoestring Group Inc | -- | None Available | |
| Federal National Mortgage Association | $47,898 | None Available |
Source: Public Records
Tax History
| Year | Tax Paid | Tax Assessment Tax Assessment Total Assessment is a certain percentage of the fair market value that is determined by local assessors to be the total taxable value of land and additions on the property. | Land | Improvement |
|---|---|---|---|---|
| 2025 | $832 | $49,400 | $3,800 | $45,600 |
| 2024 | $832 | $36,200 | $3,800 | $32,400 |
| 2023 | $840 | $36,600 | $3,200 | $33,400 |
| 2022 | $714 | $30,300 | $3,200 | $27,100 |
| 2021 | $700 | $29,600 | $4,900 | $24,700 |
| 2020 | $622 | $25,700 | $4,900 | $20,800 |
| 2019 | $586 | $23,900 | $4,900 | $19,000 |
| 2018 | $586 | $23,900 | $4,900 | $19,000 |
| 2017 | $1,463 | $27,000 | $5,400 | $21,600 |
| 2016 | $786 | $33,900 | $6,800 | $27,100 |
| 2014 | $727 | $34,200 | $6,800 | $27,400 |
| 2013 | -- | $33,900 | $6,800 | $27,100 |
Source: Public Records
Map
Nearby Homes
- 1224 S Beacon St
- 1000 E Willard St
- 1206 S Madison St
- 1402 E Willard St
- 1008 E Kirby Ave
- 1311 E Kirby Ave
- 1302 E Kirby Ave
- 221 E 6th St
- 1715 S Madison St
- 1921 S Hackley St
- 808 E 13th St
- 117 E 7th St
- 633 S Ohio Ave
- 2007 S Penn St
- 800 S Macedonia Ave
- 1403 S Shipley St
- 1202 S Shipley St
- 1005 E Jackson St
- 2108 S Grant St
- 1114 E Jackson St
- 1219 S Ebright St
- 917 E 5th St
- 1221 S Ebright St
- 915 E 5th St
- 909 E 5th St
- 1210 S Hackley St
- 903 E 5th St
- 1001 E 5th St
- 1301 S Ebright St
- 1210 S Ebright St
- 1212 S Ebright St
- 1220 S Ebright St
- 1307 S Ebright St
- 1302 S Hackley St
- 1005 E 5th St
- 1300 S Ebright St
- 1304 S Hackley St
- 1311 S Ebright St
- 1308 S Ebright St
- 1000 E 5th St
Your Personal Tour Guide
Ask me questions while you tour the home.