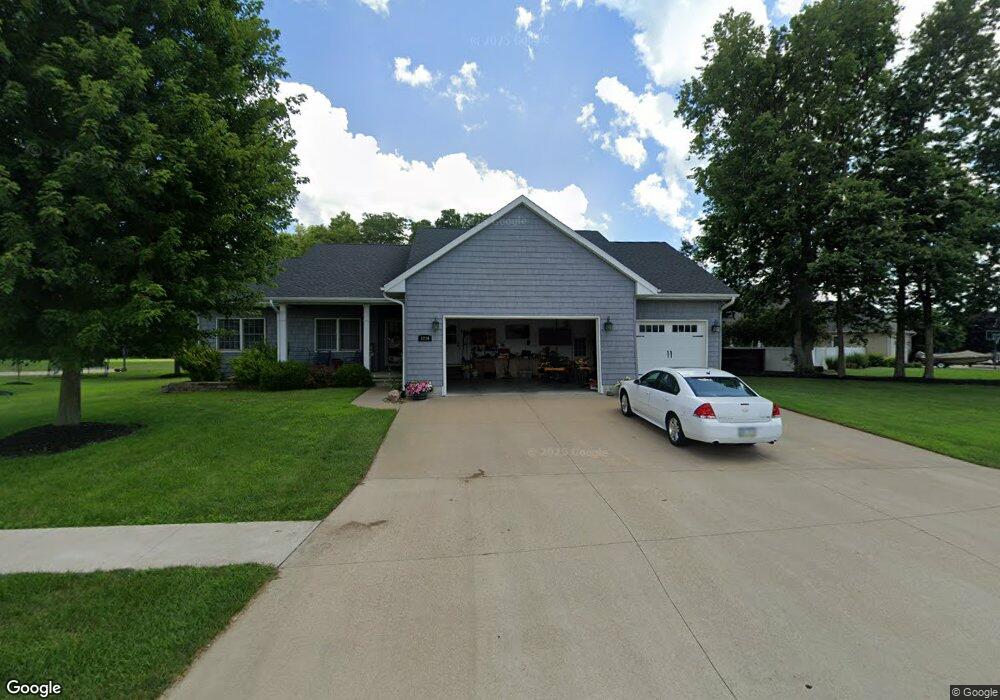
1216 23rd Ave Camanche, IA 52730
Estimated Value: $407,000 - $486,682
4
Beds
5
Baths
1,702
Sq Ft
$251/Sq Ft
Est. Value
About This Home
This home is located at 1216 23rd Ave, Camanche, IA 52730 and is currently estimated at $427,921, approximately $251 per square foot. 1216 23rd Ave is a home with nearby schools including Camanche Elementary School, Camanche Middle School, and Camanche High School.
Ownership History
Date
Name
Owned For
Owner Type
Purchase Details
Closed on
Sep 10, 2025
Sold by
Davis Joshua P and Davis Hilary E
Bought by
Joshua P Davis Estate Trust and Davis
Current Estimated Value
Purchase Details
Closed on
Mar 30, 2022
Sold by
Nielsen Steven F and Nielsen Theresa M
Bought by
Davis Joshua P and Davis Hilary
Home Financials for this Owner
Home Financials are based on the most recent Mortgage that was taken out on this home.
Original Mortgage
$344,000
Interest Rate
3.25%
Mortgage Type
New Conventional
Purchase Details
Closed on
Jan 31, 2017
Sold by
Nielsen Nicole B
Bought by
Nielsen Theresa M
Create a Home Valuation Report for This Property
The Home Valuation Report is an in-depth analysis detailing your home's value as well as a comparison with similar homes in the area
Home Values in the Area
Average Home Value in this Area
Purchase History
| Date | Buyer | Sale Price | Title Company |
|---|---|---|---|
| Joshua P Davis Estate Trust | -- | None Listed On Document | |
| Davis Joshua P | $429,875 | None Listed On Document | |
| Nielsen Theresa M | -- | None Available |
Source: Public Records
Mortgage History
| Date | Status | Borrower | Loan Amount |
|---|---|---|---|
| Previous Owner | Davis Joshua P | $344,000 |
Source: Public Records
Tax History Compared to Growth
Tax History
| Year | Tax Paid | Tax Assessment Tax Assessment Total Assessment is a certain percentage of the fair market value that is determined by local assessors to be the total taxable value of land and additions on the property. | Land | Improvement |
|---|---|---|---|---|
| 2025 | $7,184 | $426,030 | $64,500 | $361,530 |
| 2024 | $7,184 | $391,420 | $64,500 | $326,920 |
| 2023 | $6,928 | $391,420 | $64,500 | $326,920 |
| 2022 | $5,602 | $350,110 | $64,500 | $285,610 |
| 2021 | $5,412 | $280,360 | $36,900 | $243,460 |
| 2020 | $5,412 | $267,550 | $36,900 | $230,650 |
| 2019 | $4,746 | $254,730 | $0 | $0 |
| 2018 | $4,924 | $254,730 | $0 | $0 |
| 2017 | $5,708 | $254,730 | $0 | $0 |
| 2016 | $5,340 | $279,730 | $0 | $0 |
| 2015 | $5,340 | $279,730 | $0 | $0 |
| 2014 | $5,410 | $279,730 | $0 | $0 |
| 2013 | $5,324 | $0 | $0 | $0 |
Source: Public Records
Map
Nearby Homes