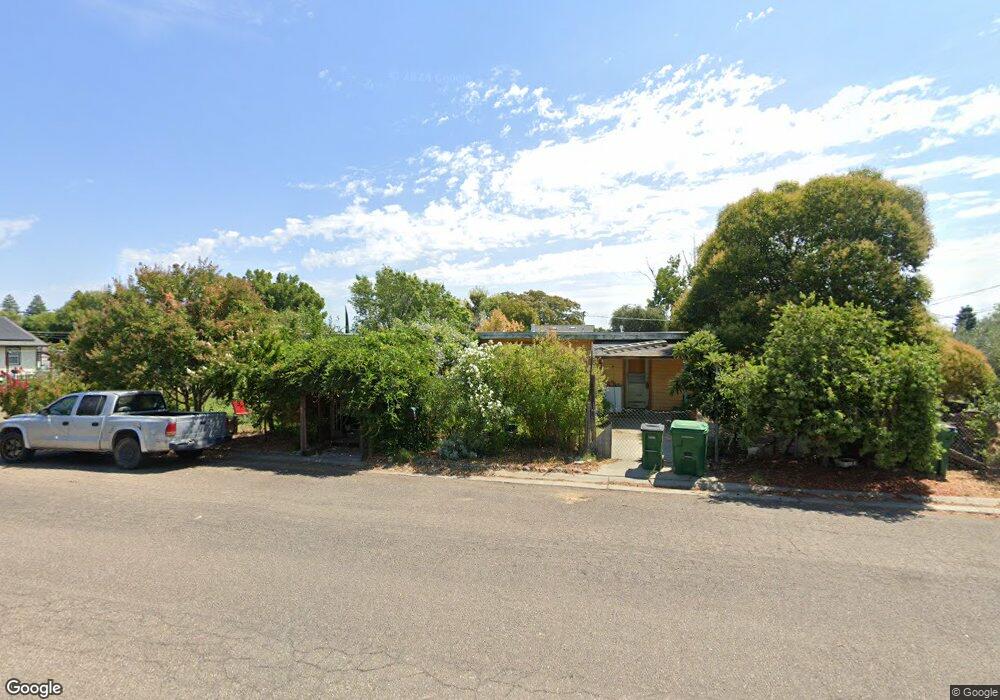
1219 Pear St Corning, CA 96021
Estimated Value: $198,000 - $290,000
3
Beds
1
Bath
987
Sq Ft
$239/Sq Ft
Est. Value
About This Home
This home is located at 1219 Pear St, Corning, CA 96021 and is currently estimated at $236,219, approximately $239 per square foot. 1219 Pear St is a home located in Tehama County with nearby schools including Olive View Elementary School, Maywood Middle School, and Corning High School.
Ownership History
Date
Name
Owned For
Owner Type
Purchase Details
Closed on
Feb 20, 2009
Sold by
Liquidation Properties Inc
Bought by
Camacho Inez Solorio and Desolorio Juana Moreno
Current Estimated Value
Home Financials for this Owner
Home Financials are based on the most recent Mortgage that was taken out on this home.
Original Mortgage
$83,640
Interest Rate
4.8%
Mortgage Type
New Conventional
Purchase Details
Closed on
Jan 23, 2009
Sold by
Teran Joseph and Teran Melodina
Bought by
Liquidation Properties Inc
Home Financials for this Owner
Home Financials are based on the most recent Mortgage that was taken out on this home.
Original Mortgage
$83,640
Interest Rate
4.8%
Mortgage Type
New Conventional
Purchase Details
Closed on
Sep 17, 2003
Sold by
Barba Louis Lional
Bought by
Teran Joseph and Teran Melodina
Home Financials for this Owner
Home Financials are based on the most recent Mortgage that was taken out on this home.
Original Mortgage
$88,800
Interest Rate
6.35%
Mortgage Type
Unknown
Purchase Details
Closed on
Oct 24, 2002
Sold by
Butler Jack V and Butler Vera I
Bought by
Barba Louis Lional
Create a Home Valuation Report for This Property
The Home Valuation Report is an in-depth analysis detailing your home's value as well as a comparison with similar homes in the area
Purchase History
| Date | Buyer | Sale Price | Title Company |
|---|---|---|---|
| Camacho Inez Solorio | $82,000 | Lsi Title Company Ca | |
| Liquidation Properties Inc | $87,200 | Title Court Services Inc | |
| Teran Joseph | $120,000 | Northern California Title Co | |
| Barba Louis Lional | $50,000 | Chicago Title Co |
Source: Public Records
Mortgage History
| Date | Status | Borrower | Loan Amount |
|---|---|---|---|
| Previous Owner | Camacho Inez Solorio | $83,640 | |
| Previous Owner | Teran Joseph | $88,800 | |
| Closed | Teran Joseph | $22,200 |
Source: Public Records
Tax History
| Year | Tax Paid | Tax Assessment Tax Assessment Total Assessment is a certain percentage of the fair market value that is determined by local assessors to be the total taxable value of land and additions on the property. | Land | Improvement |
|---|---|---|---|---|
| 2025 | $1,019 | $105,587 | $51,505 | $54,082 |
| 2023 | $999 | $101,489 | $49,506 | $51,983 |
| 2022 | $983 | $99,500 | $48,536 | $50,964 |
| 2021 | $945 | $97,550 | $47,585 | $49,965 |
| 2020 | $955 | $96,551 | $47,098 | $49,453 |
| 2019 | $914 | $94,659 | $46,175 | $48,484 |
| 2018 | $863 | $87,949 | $42,902 | $45,047 |
| 2017 | $789 | $79,954 | $39,002 | $40,952 |
| 2016 | $711 | $76,147 | $37,145 | $39,002 |
| 2015 | $718 | $76,147 | $37,145 | $39,002 |
| 2014 | $617 | $66,215 | $32,300 | $33,915 |
Source: Public Records
Map
Nearby Homes
Your Personal Tour Guide
Ask me questions while you tour the home.