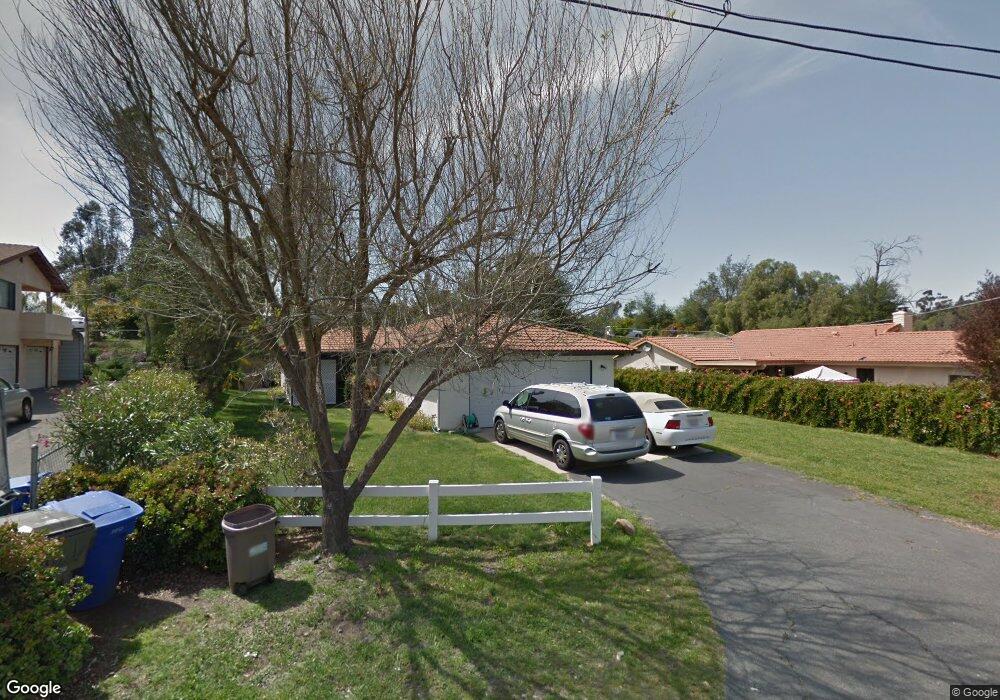
122 Lillian Way Fallbrook, CA 92028
Estimated Value: $664,880 - $699,000
3
Beds
2
Baths
1,451
Sq Ft
$465/Sq Ft
Est. Value
About This Home
This home is located at 122 Lillian Way, Fallbrook, CA 92028 and is currently estimated at $674,720, approximately $465 per square foot. 122 Lillian Way is a home located in San Diego County with nearby schools including William H. Frazier Elementary School, James E. Potter Intermediate School, and Fallbrook High School.
Ownership History
Date
Name
Owned For
Owner Type
Purchase Details
Closed on
Mar 4, 2021
Sold by
Hand Brian N and Hand Family 1983 2003 Trust
Bought by
Hand Brian N
Current Estimated Value
Create a Home Valuation Report for This Property
The Home Valuation Report is an in-depth analysis detailing your home's value as well as a comparison with similar homes in the area
Home Values in the Area
Average Home Value in this Area
Purchase History
| Date | Buyer | Sale Price | Title Company |
|---|---|---|---|
| Hand Brian N | -- | None Listed On Document |
Source: Public Records
Tax History
| Year | Tax Paid | Tax Assessment Tax Assessment Total Assessment is a certain percentage of the fair market value that is determined by local assessors to be the total taxable value of land and additions on the property. | Land | Improvement |
|---|---|---|---|---|
| 2025 | $1,362 | $127,460 | $24,433 | $103,027 |
| 2024 | $1,362 | $124,961 | $23,954 | $101,007 |
| 2023 | $1,332 | $122,512 | $23,485 | $99,027 |
| 2022 | $1,332 | $120,111 | $23,025 | $97,086 |
| 2021 | $1,288 | $117,757 | $22,574 | $95,183 |
| 2020 | $1,297 | $116,551 | $22,343 | $94,208 |
| 2019 | $1,272 | $114,266 | $21,905 | $92,361 |
| 2018 | $1,253 | $112,026 | $21,476 | $90,550 |
| 2017 | $1,228 | $109,830 | $21,055 | $88,775 |
| 2016 | $1,197 | $107,678 | $20,643 | $87,035 |
| 2015 | $1,178 | $106,061 | $20,333 | $85,728 |
| 2014 | $1,157 | $103,984 | $19,935 | $84,049 |
Source: Public Records
Map
Nearby Homes
- 868 E Alvarado St Unit 7
- 868 E Alvarado St Unit 47
- 741 Rossiter Ln
- 502 E Elder St
- 113 Gardenside Ct
- 678 Robby Way
- 0 Via Vonnie Unit SW26054903
- 535 Shady Glen Dr
- 508 Village View Place
- 210 S Orange Ave
- 842 Porter Way
- 1120 E Mission Rd Unit 33
- 1120 E Mission Rd Unit 39
- 1120 E Mission Rd Unit 44
- 1120 E Mission Rd Unit 22
- 1120 E Mission Rd Unit 102
- 1120 E Mission Rd Unit 20
- 1120 E Mission Rd Unit 79
- 1120 E Mission Rd Unit 57
- 1120 E Unit 39
- 130 Lillian Way
- 108 Lillian Way Unit 10
- 131 Lillian Way
- 131 Lillian Way Unit B
- 00 Lillian Way
- 138 Lillian Way
- 117 Lillian Way Unit 19
- 0 Lillian Way
- 802 E Alvarado St
- 746 E Alvarado St Unit 50
- 146 Lillian Way
- N/A NE North Brandon Road & East Alvarado Rd NE
- 143 Lillian Way Unit A-D
- 143 Lillian Way
- 143A Lillian Way Unit D
- 154 Lillian Way
- 741 E Alvarado St
- N/K NE North Brandon Road & East Alvarado St NE
- 104 Potter St
- 755 E Alvarado St
Your Personal Tour Guide
Ask me questions while you tour the home.