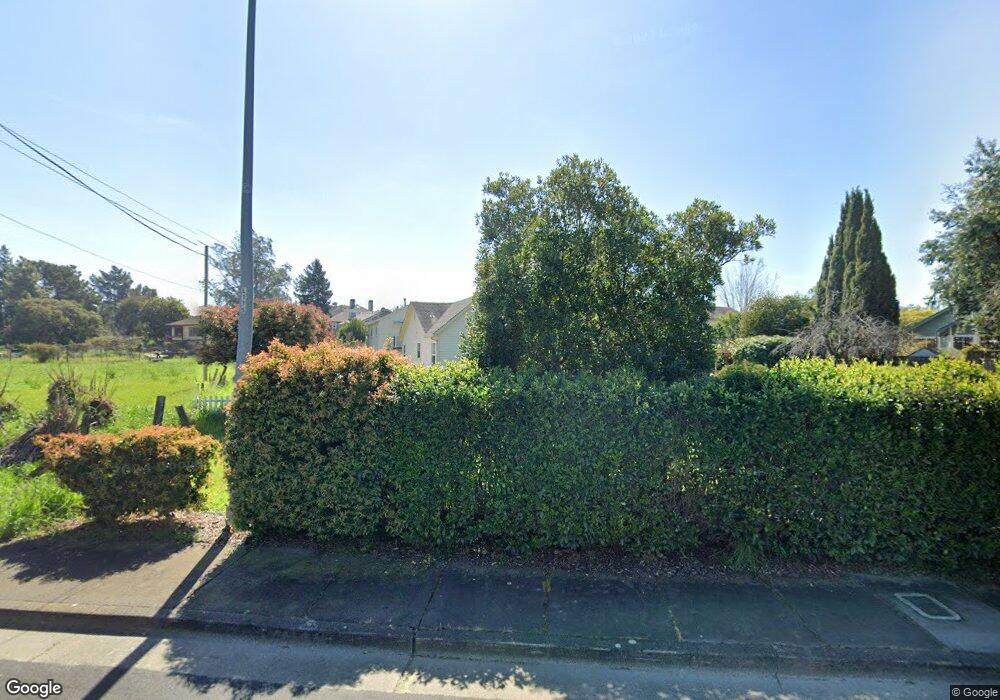
122 Myrtle Ave Cotati, CA 94931
Estimated Value: $691,000 - $788,000
2
Beds
1
Bath
1,816
Sq Ft
$398/Sq Ft
Est. Value
About This Home
This home is located at 122 Myrtle Ave, Cotati, CA 94931 and is currently estimated at $722,388, approximately $397 per square foot. 122 Myrtle Ave is a home located in Sonoma County with nearby schools including Rancho Cotate High School, Cross & Crown Lutheran School, and Bridghaven.
Ownership History
Date
Name
Owned For
Owner Type
Purchase Details
Closed on
Feb 20, 2025
Sold by
Steve Anderson and Steve Joanne Del
Bought by
S Anderson Family Living Trust and Anderson
Current Estimated Value
Purchase Details
Closed on
May 6, 2013
Sold by
The Steve Anderson & Joanne Del Coral Li
Bought by
Anderson Steven Edward and Anderson Del Corral
Home Financials for this Owner
Home Financials are based on the most recent Mortgage that was taken out on this home.
Original Mortgage
$102,000
Interest Rate
3.54%
Mortgage Type
New Conventional
Purchase Details
Closed on
May 3, 2006
Sold by
Anderson Steven Edward and Anderson Del Corral
Bought by
Anderson Steven Edward and Anderson Del Corral
Purchase Details
Closed on
Feb 19, 1991
Bought by
Anderson Steven Edward Tr & Del Corral Joanne
Create a Home Valuation Report for This Property
The Home Valuation Report is an in-depth analysis detailing your home's value as well as a comparison with similar homes in the area
Home Values in the Area
Average Home Value in this Area
Purchase History
| Date | Buyer | Sale Price | Title Company |
|---|---|---|---|
| S Anderson Family Living Trust | -- | None Listed On Document | |
| Anderson Steven Edward | -- | First American Title Company | |
| Anderson Steven Edward | -- | None Available | |
| Anderson Steven Edward Tr & Del Corral Joanne | $180,000 | -- | |
| Anderson Steven Edward Tr & Del Corral Joanne | $180,000 | -- |
Source: Public Records
Mortgage History
| Date | Status | Borrower | Loan Amount |
|---|---|---|---|
| Previous Owner | Anderson Steven Edward | $102,000 |
Source: Public Records
Tax History
| Year | Tax Paid | Tax Assessment Tax Assessment Total Assessment is a certain percentage of the fair market value that is determined by local assessors to be the total taxable value of land and additions on the property. | Land | Improvement |
|---|---|---|---|---|
| 2025 | $4,028 | $324,639 | $144,282 | $180,357 |
| 2024 | $4,028 | $318,274 | $141,453 | $176,821 |
| 2023 | $4,028 | $312,034 | $138,680 | $173,354 |
| 2022 | $3,935 | $305,916 | $135,961 | $169,955 |
| 2021 | $3,896 | $299,919 | $133,296 | $166,623 |
| 2020 | $3,938 | $296,845 | $131,930 | $164,915 |
| 2019 | $3,888 | $291,026 | $129,344 | $161,682 |
| 2018 | $3,599 | $285,320 | $126,808 | $158,512 |
| 2017 | $3,540 | $279,726 | $124,322 | $155,404 |
| 2016 | $3,394 | $274,242 | $121,885 | $152,357 |
| 2015 | $3,314 | $270,124 | $120,055 | $150,069 |
| 2014 | $3,291 | $264,834 | $117,704 | $147,130 |
Source: Public Records
Map
Nearby Homes
- 8873 Lebec Ln
- 95 Jagla St
- 105 Falcon Dr
- 65 Lasker Ln
- 9 Ramble Creek Dr
- 293 Lincoln Ave
- 8383 Lasalle Ave Unit 66
- 9011 Cypress Ave
- 8633 Lancaster Dr
- 8175 Arthur St
- 8 Bay Tree Ct
- 302 Floral Dr
- 286 Bruce Ave
- 117 Silver Dr
- 7799 Blair Ave
- 850 E Cotati Ave Unit 11
- 79 William St Unit S
- 6698 Santero Way
- 1217 Mateo Dr
- 1216 Mateo Dr
- 108 Macklin Dr
- 104 Macklin Dr
- 112 Macklin Dr
- 200 Skilling Ct
- 100 Macklin Dr
- 204 Skilling Ct
- 208 Skilling Ct
- 188 Myrtle Ave
- 163 Myrtle Ave
- 111 Macklin Dr
- 116 Macklin Dr
- 107 Macklin Dr
- 115 Macklin Dr
- 212 Skilling Ct
- 103 Macklin Dr
- 183 Robin Ave
- 201 Skilling Ct
- 120 Macklin Dr
- 8591 Wren Dr
- 201 Mendelssohn Ct
Your Personal Tour Guide
Ask me questions while you tour the home.