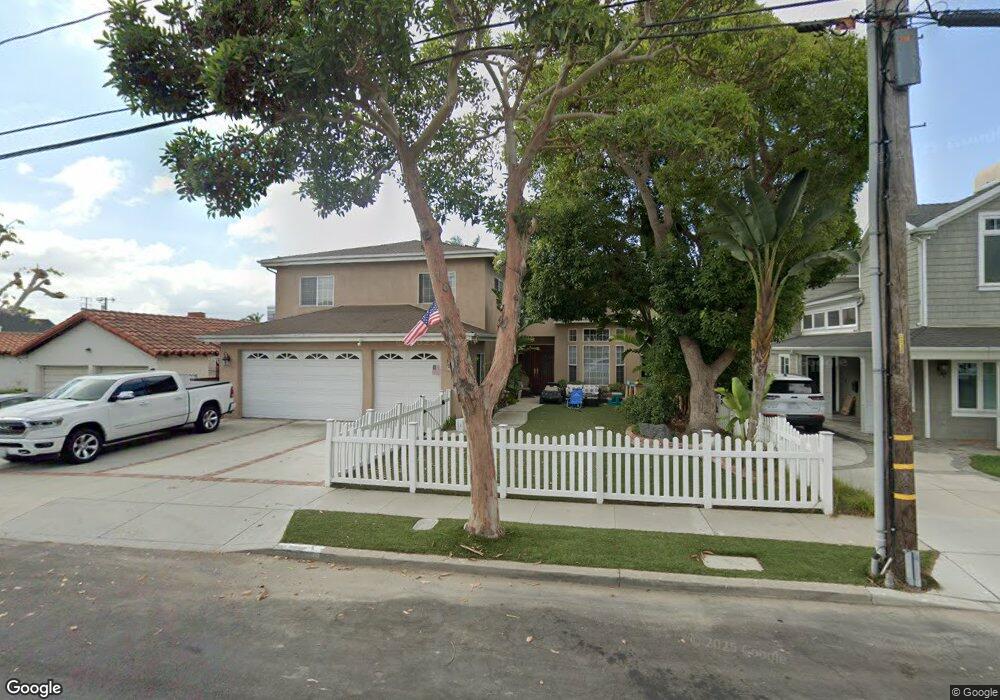
1220 E Sycamore Ave El Segundo, CA 90245
Estimated Value: $1,237,000 - $3,749,000
5
Beds
5
Baths
4,922
Sq Ft
$556/Sq Ft
Est. Value
About This Home
This home is located at 1220 E Sycamore Ave, El Segundo, CA 90245 and is currently estimated at $2,738,429, approximately $556 per square foot. 1220 E Sycamore Ave is a home located in Los Angeles County with nearby schools including Center Street Elementary, El Segundo Middle School, and El Segundo High School.
Ownership History
Date
Name
Owned For
Owner Type
Purchase Details
Closed on
Feb 2, 2010
Sold by
Rich Gregory S
Bought by
Rich Gregory S and Glynn Rich Colleen P
Current Estimated Value
Purchase Details
Closed on
Sep 27, 1996
Sold by
Glynn Patrick
Bought by
Glynn Rich Colleen P and Rich Gregory S
Home Financials for this Owner
Home Financials are based on the most recent Mortgage that was taken out on this home.
Original Mortgage
$131,816
Outstanding Balance
$11,219
Interest Rate
8.1%
Mortgage Type
Seller Take Back
Estimated Equity
$2,727,210
Purchase Details
Closed on
Nov 15, 1993
Sold by
Glynn Patrick
Bought by
Glynn Patrick and Glynn Elizabeth Lucille
Create a Home Valuation Report for This Property
The Home Valuation Report is an in-depth analysis detailing your home's value as well as a comparison with similar homes in the area
Home Values in the Area
Average Home Value in this Area
Purchase History
| Date | Buyer | Sale Price | Title Company |
|---|---|---|---|
| Rich Gregory S | -- | None Available | |
| Glynn Rich Colleen P | $200,000 | -- | |
| Glynn Patrick | -- | -- | |
| Glynn Patrick | -- | -- |
Source: Public Records
Mortgage History
| Date | Status | Borrower | Loan Amount |
|---|---|---|---|
| Open | Glynn Rich Colleen P | $131,816 |
Source: Public Records
Tax History
| Year | Tax Paid | Tax Assessment Tax Assessment Total Assessment is a certain percentage of the fair market value that is determined by local assessors to be the total taxable value of land and additions on the property. | Land | Improvement |
|---|---|---|---|---|
| 2025 | $7,674 | $642,913 | $74,007 | $568,906 |
| 2024 | $7,427 | $630,307 | $72,556 | $557,751 |
| 2023 | $7,241 | $617,949 | $71,134 | $546,815 |
| 2022 | $7,312 | $605,834 | $69,740 | $536,094 |
| 2021 | $7,185 | $593,956 | $68,373 | $525,583 |
| 2020 | $7,052 | $587,866 | $67,672 | $520,194 |
| 2019 | $6,946 | $576,341 | $66,346 | $509,995 |
| 2018 | $6,455 | $565,042 | $65,046 | $499,996 |
| 2016 | $6,217 | $543,103 | $62,521 | $480,582 |
| 2015 | $6,141 | $534,946 | $61,582 | $473,364 |
| 2014 | $6,018 | $524,468 | $60,376 | $464,092 |
Source: Public Records
Map
Nearby Homes
- 825 Center St
- 860 Bungalow Dr
- 1116 E Imperial Ave
- 1112 E Imperial Ave
- 500 E Imperial Ave
- 1510 E Maple Ave
- 1514 E Maple Ave
- 906 E Imperial Ave
- 529 E Walnut Ave
- 519 E Sycamore Ave
- 572 E Imperial Ave
- 432 Lomita St
- 529 Sierra Place
- 426 E Imperial Ave
- 329 E Maple Ave
- 1225 E Grand Ave Unit B
- 212 E Imperial Ave Unit A
- 212 E Imperial Ave Unit E
- 121 E Walnut Ave
- 211 E Pine Ave
- 1218 E Sycamore Ave
- 1222 E Sycamore Ave
- 1214 E Sycamore Ave
- 1226 E Sycamore Ave
- 1257 E Maple Ave
- 1225 E Maple Ave
- 1210 E Sycamore Ave
- 815 California St
- 1219 E Maple Ave
- 1228 E Sycamore Ave
- 1221 E Sycamore Ave
- 811 California St
- 1217 E Sycamore Ave
- 1225 E Sycamore Ave
- 1208 E Sycamore Ave
- 835 California St
- 1213 E Maple Ave
- 1265 E Maple Ave
- 1213 E Sycamore Ave
- 839 California St
Your Personal Tour Guide
Ask me questions while you tour the home.