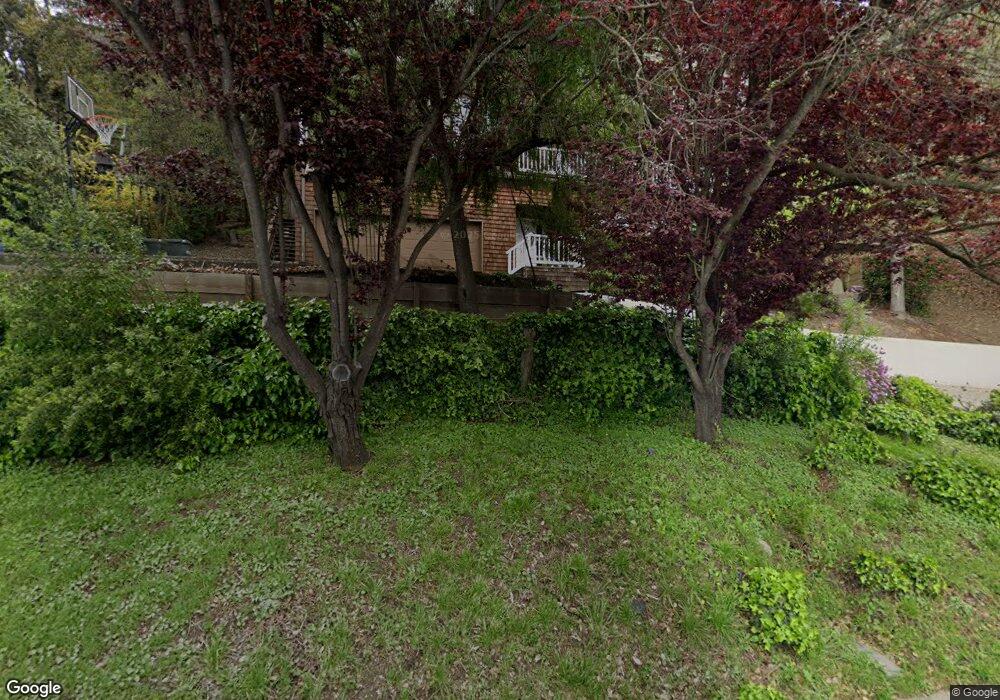
1221 Grizzly Peak Blvd Berkeley, CA 94708
Berkeley Hills NeighborhoodEstimated Value: $1,341,000 - $1,699,467
3
Beds
3
Baths
2,106
Sq Ft
$722/Sq Ft
Est. Value
About This Home
This home is located at 1221 Grizzly Peak Blvd, Berkeley, CA 94708 and is currently estimated at $1,520,367, approximately $721 per square foot. 1221 Grizzly Peak Blvd is a home located in Alameda County with nearby schools including Cragmont Elementary School, Berkeley Arts Magnet at Whittier School, and Washington Elementary School.
Ownership History
Date
Name
Owned For
Owner Type
Purchase Details
Closed on
Jul 18, 2006
Sold by
Rio Donald C and Rendahl Katherine Gates
Bought by
Rio Donald C and Rendahl Katherine G
Current Estimated Value
Purchase Details
Closed on
Aug 15, 2003
Sold by
Rio Donald C
Bought by
Rio Donald C and Rendahl Katherine Gates
Home Financials for this Owner
Home Financials are based on the most recent Mortgage that was taken out on this home.
Original Mortgage
$253,736
Interest Rate
6.06%
Mortgage Type
Purchase Money Mortgage
Purchase Details
Closed on
Oct 31, 1995
Sold by
Rio Donald C
Bought by
Rio Donald C
Create a Home Valuation Report for This Property
The Home Valuation Report is an in-depth analysis detailing your home's value as well as a comparison with similar homes in the area
Home Values in the Area
Average Home Value in this Area
Purchase History
| Date | Buyer | Sale Price | Title Company |
|---|---|---|---|
| Rio Donald C | -- | None Available | |
| Rio Donald C | -- | First American Title Company | |
| Rio Donald C | -- | -- |
Source: Public Records
Mortgage History
| Date | Status | Borrower | Loan Amount |
|---|---|---|---|
| Previous Owner | Rio Donald C | $253,736 |
Source: Public Records
Tax History Compared to Growth
Tax History
| Year | Tax Paid | Tax Assessment Tax Assessment Total Assessment is a certain percentage of the fair market value that is determined by local assessors to be the total taxable value of land and additions on the property. | Land | Improvement |
|---|---|---|---|---|
| 2025 | $12,499 | $694,934 | $210,580 | $491,354 |
| 2024 | $12,499 | $681,173 | $206,452 | $481,721 |
| 2023 | $12,116 | $674,680 | $202,404 | $472,276 |
| 2022 | $11,765 | $654,451 | $198,435 | $463,016 |
| 2021 | $11,780 | $641,484 | $194,545 | $453,939 |
| 2020 | $11,196 | $641,834 | $192,550 | $449,284 |
| 2019 | $10,783 | $629,250 | $188,775 | $440,475 |
| 2018 | $10,572 | $616,914 | $185,074 | $431,840 |
| 2017 | $10,188 | $604,821 | $181,446 | $423,375 |
| 2016 | $9,851 | $592,964 | $177,889 | $415,075 |
| 2015 | $9,703 | $584,060 | $175,218 | $408,842 |
| 2014 | $9,561 | $572,620 | $171,786 | $400,834 |
Source: Public Records
Map
Nearby Homes
- 0 Queens Rd Unit ML82024219
- 1375 Queens Rd
- 1165 Cragmont Ave
- 1136 Keith Ave
- 1005 Miller Ave
- 946 Creston Rd
- 1444 Scenic Ave
- 971 Santa Barbara Rd
- 2517 Cedar St
- 1700 La Vereda Rd
- 1141 Oxford St
- 2634 Virginia St Unit 13
- 2700 Le Conte Ave Unit 301
- 1700 Le Roy Ave
- 2477 Virginia St
- 2451 Le Conte Ave
- 1444 Walnut St
- 1512 Walnut St
- 2201 Virginia St Unit 2
- 2201 Virginia St Unit 3
- 1231 Grizzly Peak Blvd
- 40 Hill Rd
- 1211 Grizzly Peak Blvd
- 34 Hill Rd
- 1 Hill Rd
- 48 Hill Rd
- 1220 Grizzly Peak Blvd
- 30 Hill Rd
- 1216 Grizzly Peak Blvd
- 1230 Grizzly Peak Blvd
- 55 Hill Rd
- 1212 Grizzly Peak Blvd
- 1241 Grizzly Peak Blvd
- 28 Hill Rd
- 1234 Grizzly Peak Blvd
- 1210 Grizzly Peak Blvd
- 2958 Shasta Rd
- 29 Hill Rd
- 2956 Shasta Rd
- 57 Hill Rd