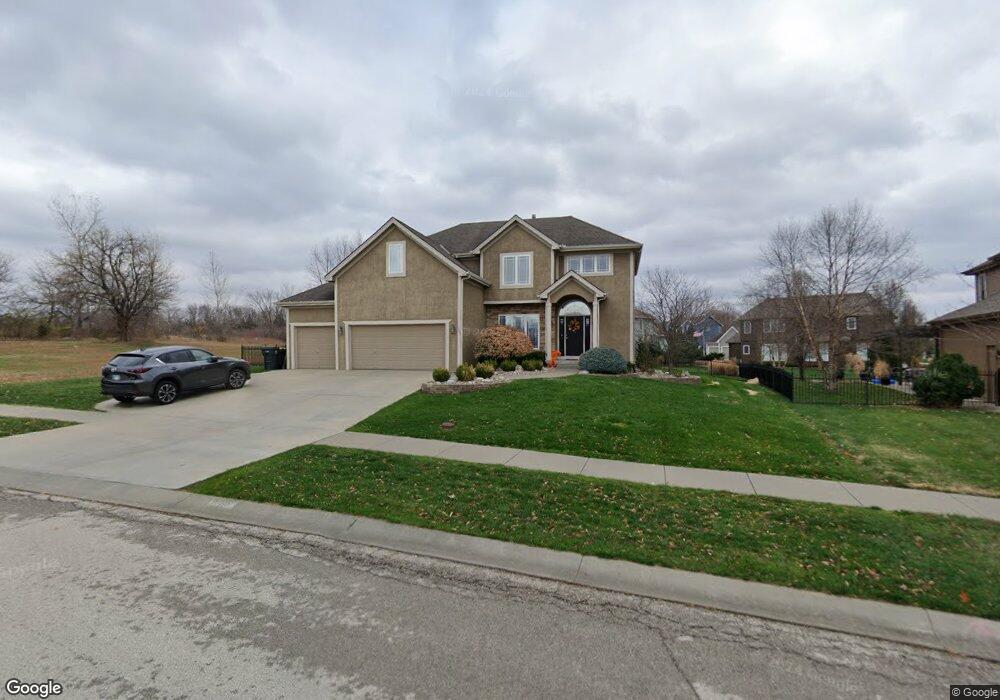
1223 Clearview Dr Lansing, KS 66043
Estimated Value: $450,000 - $465,000
4
Beds
4
Baths
2,769
Sq Ft
$164/Sq Ft
Est. Value
About This Home
This home is located at 1223 Clearview Dr, Lansing, KS 66043 and is currently estimated at $455,460, approximately $164 per square foot. 1223 Clearview Dr is a home located in Leavenworth County with nearby schools including Lansing Elementary School, Lansing Middle 6-8, and Lansing High 9-12.
Ownership History
Date
Name
Owned For
Owner Type
Purchase Details
Closed on
Mar 26, 2012
Sold by
Jmk Ptshp
Bought by
Ortega Jennifer Drew
Current Estimated Value
Home Financials for this Owner
Home Financials are based on the most recent Mortgage that was taken out on this home.
Original Mortgage
$306,450
Outstanding Balance
$236,926
Interest Rate
5.26%
Mortgage Type
New Conventional
Estimated Equity
$218,534
Create a Home Valuation Report for This Property
The Home Valuation Report is an in-depth analysis detailing your home's value as well as a comparison with similar homes in the area
Home Values in the Area
Average Home Value in this Area
Purchase History
| Date | Buyer | Sale Price | Title Company |
|---|---|---|---|
| Ortega Jennifer Drew | -- | -- |
Source: Public Records
Mortgage History
| Date | Status | Borrower | Loan Amount |
|---|---|---|---|
| Open | Ortega Jennifer Drew | $306,450 |
Source: Public Records
Tax History Compared to Growth
Tax History
| Year | Tax Paid | Tax Assessment Tax Assessment Total Assessment is a certain percentage of the fair market value that is determined by local assessors to be the total taxable value of land and additions on the property. | Land | Improvement |
|---|---|---|---|---|
| 2025 | $6,685 | $51,249 | $6,249 | $45,000 |
| 2024 | $6,295 | $49,277 | $6,249 | $43,028 |
| 2023 | $6,295 | $48,219 | $6,249 | $41,970 |
| 2022 | $6,164 | $44,631 | $5,293 | $39,338 |
| 2021 | $5,716 | $39,594 | $5,293 | $34,301 |
| 2020 | $5,317 | $36,259 | $5,293 | $30,966 |
| 2019 | $5,227 | $35,604 | $5,293 | $30,311 |
| 2018 | $5,213 | $35,523 | $5,293 | $30,230 |
| 2017 | $5,080 | $34,550 | $5,293 | $29,257 |
| 2016 | $5,150 | $35,006 | $5,293 | $29,713 |
| 2015 | $5,135 | $35,006 | $5,293 | $29,713 |
| 2014 | $4,787 | $33,331 | $5,293 | $28,038 |
Source: Public Records
Map
Nearby Homes
- 866 Clearview Dr
- 875 Clearview Dr
- 1322 Rock Creek Ct
- 922 Southfork St
- 1221 S Desoto Rd
- 833 Rock Creek Dr
- 811 4-H Rd
- 000 4-H Rd
- 527 S Valley Dr
- 104 Olive St
- 24431 139th St
- 13965 Mc Intyre Rd
- 13788 McIntyre1 Rd
- 13788 Mcintyre Rd
- 13788 McIntyre2 Rd
- 522 Forestglen Ln
- 202 S Main St
- 124 S Main St
- 546 Hithergreen Dr
- 20958 Ida St