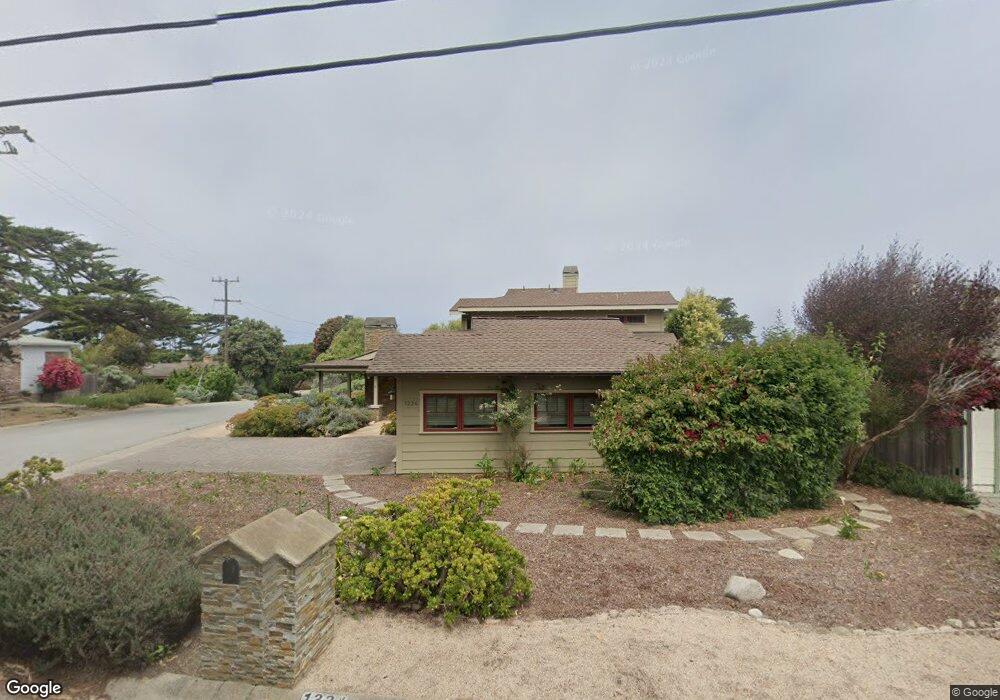
1224 Del Monte Blvd Pacific Grove, CA 93950
Estimated Value: $2,067,000 - $2,953,408
4
Beds
2
Baths
2,403
Sq Ft
$1,039/Sq Ft
Est. Value
About This Home
This home is located at 1224 Del Monte Blvd, Pacific Grove, CA 93950 and is currently estimated at $2,496,102, approximately $1,038 per square foot. 1224 Del Monte Blvd is a home located in Monterey County with nearby schools including Robert Down Elementary School, Pacific Grove Middle School, and Pacific Grove High School.
Ownership History
Date
Name
Owned For
Owner Type
Purchase Details
Closed on
Dec 31, 2019
Sold by
Wentworth Fredrick A and Wentworth Judy A
Bought by
Wentworth Fredrick A and Wentworth Judy A
Current Estimated Value
Purchase Details
Closed on
Apr 12, 2004
Sold by
Phillips Geoffrey D
Bought by
Wnentworth Fredrick A and Wentworth Judy A
Home Financials for this Owner
Home Financials are based on the most recent Mortgage that was taken out on this home.
Original Mortgage
$760,000
Outstanding Balance
$350,898
Interest Rate
5.39%
Mortgage Type
Credit Line Revolving
Estimated Equity
$2,145,204
Purchase Details
Closed on
Jan 6, 2003
Sold by
Kuhler Joseph W
Bought by
Phillips Geoffrey D
Home Financials for this Owner
Home Financials are based on the most recent Mortgage that was taken out on this home.
Original Mortgage
$552,000
Interest Rate
5.83%
Create a Home Valuation Report for This Property
The Home Valuation Report is an in-depth analysis detailing your home's value as well as a comparison with similar homes in the area
Home Values in the Area
Average Home Value in this Area
Purchase History
| Date | Buyer | Sale Price | Title Company |
|---|---|---|---|
| Wentworth Fredrick A | -- | None Available | |
| Wnentworth Fredrick A | $950,000 | Stewart Title | |
| Phillips Geoffrey D | $690,000 | Stewart Title |
Source: Public Records
Mortgage History
| Date | Status | Borrower | Loan Amount |
|---|---|---|---|
| Open | Wnentworth Fredrick A | $760,000 | |
| Previous Owner | Phillips Geoffrey D | $552,000 | |
| Closed | Phillips Geoffrey D | $69,000 |
Source: Public Records
Tax History Compared to Growth
Tax History
| Year | Tax Paid | Tax Assessment Tax Assessment Total Assessment is a certain percentage of the fair market value that is determined by local assessors to be the total taxable value of land and additions on the property. | Land | Improvement |
|---|---|---|---|---|
| 2025 | $17,189 | $1,644,563 | $995,247 | $649,316 |
| 2024 | $17,189 | $1,612,318 | $975,733 | $636,585 |
| 2023 | $17,445 | $1,580,704 | $956,601 | $624,103 |
| 2022 | $17,092 | $1,549,711 | $937,845 | $611,866 |
| 2021 | $17,006 | $1,519,325 | $919,456 | $599,869 |
| 2020 | $16,665 | $1,503,748 | $910,029 | $593,719 |
| 2019 | $16,135 | $1,474,264 | $892,186 | $582,078 |
| 2018 | $15,813 | $1,445,358 | $874,693 | $570,665 |
| 2017 | $15,557 | $1,417,019 | $857,543 | $559,476 |
| 2016 | $14,859 | $1,323,000 | $801,000 | $522,000 |
| 2015 | $13,297 | $1,184,000 | $717,000 | $467,000 |
| 2014 | $11,538 | $1,027,000 | $622,000 | $405,000 |
Source: Public Records
Map
Nearby Homes
- 25 Coral St
- 1051 Ocean View Blvd
- 221 Pine Garden Ln
- 910 Egan Ave
- 813 Ocean View Blvd
- 775 Mermaid Ave
- 851 Bayview Ave
- 304 Grove Acre Ave
- 810 Lighthouse Ave Unit 101
- 735 Bayview Ave
- 700 Briggs Ave Unit 103
- 222 Wood St
- 311 Walnut St
- 206 Cypress Ave Unit B
- 543 Asilomar Blvd
- 585 Ocean View Blvd Unit 3
- 127 16th St
- 132 Forest Ave
- 311 Lobos Ave
- 302 Park St
- 1222 Del Monte Blvd
- 1227 Shell Ave
- 1233 Shell Ave
- 1221 Shell Ave
- 1218 Del Monte Blvd
- 1241 Shell Ave
- 1219 Shell Ave
- 1240 Del Monte Blvd
- 1212 Del Monte Blvd
- 1213 Shell Ave
- 1243 Shell Ave
- 1226 Shell Ave
- 1230 Shell Ave
- 1246 Del Monte Blvd
- 1222 Shell Ave
- 1206 Del Monte Blvd
- 1209 Shell Ave
- 1218 Shell Ave
- 1247 Shell Ave
- 1250 Del Monte Blvd