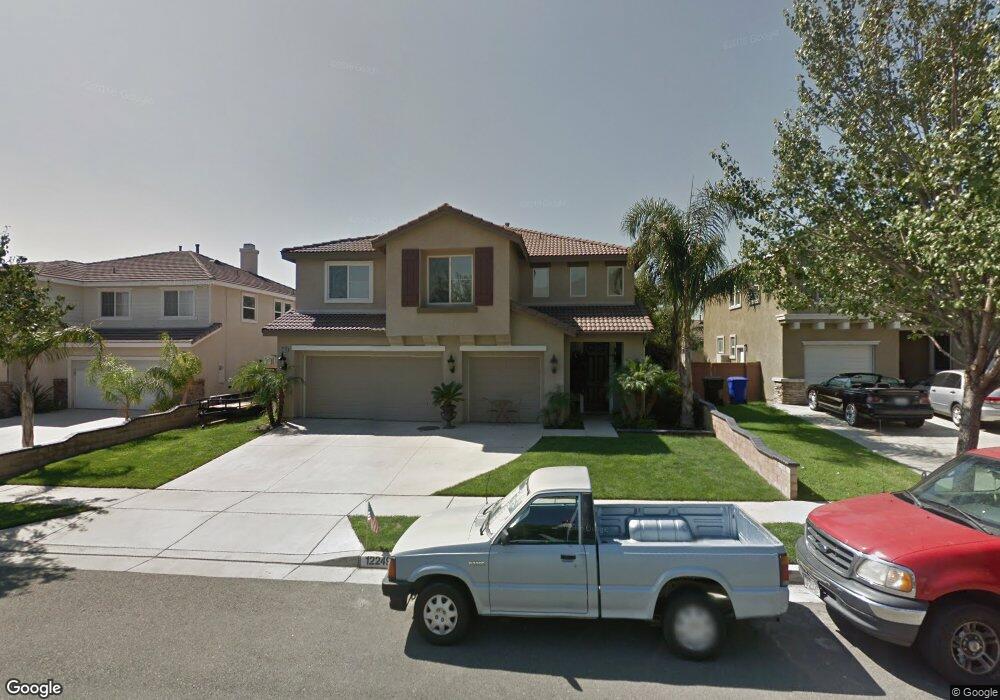
12249 Queensbury Dr Rancho Cucamonga, CA 91739
Victoria NeighborhoodEstimated Value: $919,599 - $1,000,000
5
Beds
3
Baths
2,706
Sq Ft
$358/Sq Ft
Est. Value
About This Home
This home is located at 12249 Queensbury Dr, Rancho Cucamonga, CA 91739 and is currently estimated at $968,150, approximately $357 per square foot. 12249 Queensbury Dr is a home located in San Bernardino County with nearby schools including Carleton P. Lightfoot Elementary, Day Creek Intermediate, and Rancho Cucamonga High School.
Ownership History
Date
Name
Owned For
Owner Type
Purchase Details
Closed on
May 11, 2000
Sold by
William Lyon Homes Inc
Bought by
Losing Timothy W and Losing Dawn
Current Estimated Value
Home Financials for this Owner
Home Financials are based on the most recent Mortgage that was taken out on this home.
Original Mortgage
$246,400
Interest Rate
7.96%
Create a Home Valuation Report for This Property
The Home Valuation Report is an in-depth analysis detailing your home's value as well as a comparison with similar homes in the area
Home Values in the Area
Average Home Value in this Area
Purchase History
| Date | Buyer | Sale Price | Title Company |
|---|---|---|---|
| Losing Timothy W | $259,500 | First American Title Ins Co |
Source: Public Records
Mortgage History
| Date | Status | Borrower | Loan Amount |
|---|---|---|---|
| Previous Owner | Losing Timothy W | $246,400 |
Source: Public Records
Tax History Compared to Growth
Tax History
| Year | Tax Paid | Tax Assessment Tax Assessment Total Assessment is a certain percentage of the fair market value that is determined by local assessors to be the total taxable value of land and additions on the property. | Land | Improvement |
|---|---|---|---|---|
| 2025 | $5,557 | $390,871 | $97,947 | $292,924 |
| 2024 | $5,557 | $383,206 | $96,026 | $287,180 |
| 2023 | $5,423 | $375,692 | $94,143 | $281,549 |
| 2022 | $5,344 | $368,325 | $92,297 | $276,028 |
| 2021 | $5,260 | $361,103 | $90,487 | $270,616 |
| 2020 | $5,207 | $357,400 | $89,559 | $267,841 |
| 2019 | $5,099 | $350,392 | $87,803 | $262,589 |
| 2018 | $5,089 | $343,521 | $86,081 | $257,440 |
| 2017 | $4,900 | $336,785 | $84,393 | $252,392 |
| 2016 | $4,785 | $330,181 | $82,738 | $247,443 |
| 2015 | $4,749 | $325,221 | $81,495 | $243,726 |
| 2014 | $4,649 | $318,851 | $79,899 | $238,952 |
Source: Public Records
Map
Nearby Homes
- 12206 Tunbridge Ct
- 12253 Knightsbridge Dr
- 12356 Thistle Dr
- 12331 Dove Tree Dr
- 12325 Bellflower Ct
- 12164 Wembley Ct
- 12427 Silk Oak Ct
- 6921 Dahlia Ct
- 7067 Fontaine Place
- 12420 Silk Oak Ct
- 7068 Crocus Ct
- 7077 Iris Place
- 11948 Stegmeir Dr
- 6732 Plum Way
- 6988 Edinburgh Place
- 6584 Elderberry Ct
- 6331 Thunder Mountain Ave
- 11855 Modena Dr
- 11839 Antler Peak Ct
- 7070 Pozallo Place
- 12241 Queensbury Dr
- 12257 Queensbury Dr
- 12238 Piccadilly Ct
- 12231 Queensbury Dr
- 12228 Piccadilly Ct
- 12246 Piccadilly Ct
- 12256 Piccadilly Ct
- 12252 Queensbury Dr
- 12258 Queensbury Dr
- 12244 Queensbury Dr
- 12220 Piccadilly Ct
- 12268 Queensbury Dr
- 12234 Queensbury Dr
- 6745 Birmingham Place
- 6753 Birmingham Place
- 6739 Birmingham Place
- 12214 Tunbridge Ct
- 6763 Birmingham Place
- 12239 Piccadilly Ct
- 12231 Piccadilly Ct