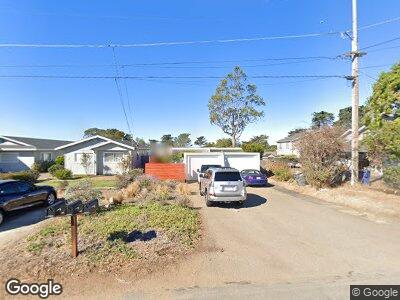
1225 5th St Unit A Los Osos, CA 93402
Los Osos NeighborhoodEstimated Value: $878,000 - $1,092,000
2
Beds
2
Baths
1,200
Sq Ft
$793/Sq Ft
Est. Value
About This Home
This home is located at 1225 5th St Unit A, Los Osos, CA 93402 and is currently estimated at $951,196, approximately $792 per square foot. 1225 5th St Unit A is a home located in San Luis Obispo County with nearby schools including Baywood Elementary School, Los Osos Middle School, and Morro Bay High School.
Ownership History
Date
Name
Owned For
Owner Type
Purchase Details
Closed on
Mar 29, 2022
Sold by
Smith White Noel and Belli Angela
Bought by
Angela Lee Belli White And Noel Smith White R
Current Estimated Value
Home Financials for this Owner
Home Financials are based on the most recent Mortgage that was taken out on this home.
Original Mortgage
$555,000
Outstanding Balance
$528,194
Interest Rate
4.42%
Mortgage Type
New Conventional
Purchase Details
Closed on
May 22, 2015
Sold by
Conrad Bruce H and Conrad Margaret L
Bought by
White Noel Smith and White Angela Lee Belli
Home Financials for this Owner
Home Financials are based on the most recent Mortgage that was taken out on this home.
Original Mortgage
$347,985
Interest Rate
3.75%
Mortgage Type
FHA
Create a Home Valuation Report for This Property
The Home Valuation Report is an in-depth analysis detailing your home's value as well as a comparison with similar homes in the area
Home Values in the Area
Average Home Value in this Area
Purchase History
| Date | Buyer | Sale Price | Title Company |
|---|---|---|---|
| Angela Lee Belli White And Noel Smith White R | -- | First American Title | |
| White Noel Smith | $447,000 | Fidelity National Title Co |
Source: Public Records
Mortgage History
| Date | Status | Borrower | Loan Amount |
|---|---|---|---|
| Open | Angela Lee Belli White And Noel Smith White R | $555,000 | |
| Previous Owner | White Noel Smith | $420,000 | |
| Previous Owner | White Noel Smith | $346,200 | |
| Previous Owner | White Noel Smith | $347,985 |
Source: Public Records
Tax History Compared to Growth
Tax History
| Year | Tax Paid | Tax Assessment Tax Assessment Total Assessment is a certain percentage of the fair market value that is determined by local assessors to be the total taxable value of land and additions on the property. | Land | Improvement |
|---|---|---|---|---|
| 2024 | $9,196 | $526,685 | $235,654 | $291,031 |
| 2023 | $9,196 | $516,359 | $231,034 | $285,325 |
| 2022 | $8,931 | $506,235 | $226,504 | $279,731 |
| 2021 | $8,551 | $496,310 | $222,063 | $274,247 |
| 2020 | $8,039 | $491,222 | $219,787 | $271,435 |
| 2019 | $8,070 | $481,591 | $215,478 | $266,113 |
| 2018 | $7,660 | $472,149 | $211,253 | $260,896 |
| 2017 | $7,929 | $462,892 | $207,111 | $255,781 |
| 2016 | $5,975 | $453,816 | $203,050 | $250,766 |
| 2015 | $4,299 | $290,821 | $168,372 | $122,449 |
| 2014 | -- | $285,125 | $165,074 | $120,051 |
Source: Public Records
Map
Nearby Homes
- 1225 5th St Unit A
- 1225 5th St
- 1241 5th St Unit A
- 777 Santa Ysabel Ave
- 1224 4th St
- 1243 5th St
- 1230 4th St
- 763 Santa Ysabel Ave Unit A
- 1232 4th St Unit A
- 1232 4th St
- 1212 5th St
- 1255 5th St Unit A&B
- 1255 5th St Unit LOS
- 1255 5th St Unit A
- 753 Santa Ysabel Ave
- 1250 4th St Unit A
- 801 Santa Ysabel Ave
- 1224 5th St
- 1230 5th St