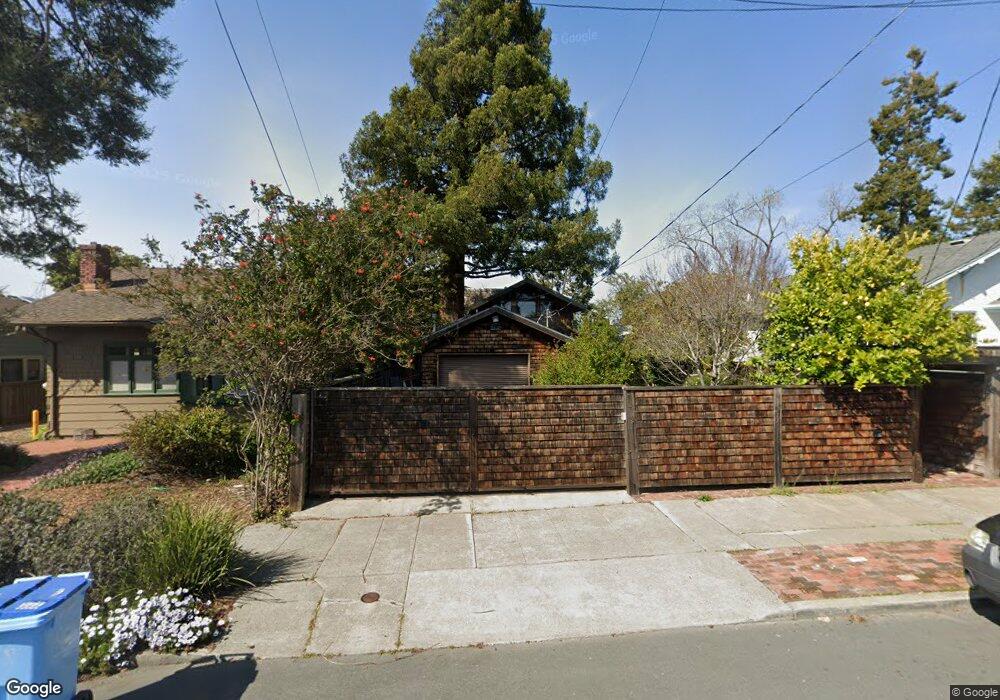
1227 Blake St Berkeley, CA 94702
West Berkeley NeighborhoodEstimated Value: $1,205,000 - $1,777,000
3
Beds
2
Baths
1,790
Sq Ft
$817/Sq Ft
Est. Value
About This Home
This home is located at 1227 Blake St, Berkeley, CA 94702 and is currently estimated at $1,462,107, approximately $816 per square foot. 1227 Blake St is a home located in Alameda County with nearby schools including Oxford Elementary School, Washington Elementary School, and Malcolm X Elementary School.
Ownership History
Date
Name
Owned For
Owner Type
Purchase Details
Closed on
Jun 11, 2010
Sold by
Ward Michael James and Ward Beth Ann
Bought by
Ward Michael James and Ward Beth Ann
Current Estimated Value
Purchase Details
Closed on
Aug 11, 2009
Sold by
Duncan Marc K
Bought by
Ward Andrew Michael and Ward Michael James
Home Financials for this Owner
Home Financials are based on the most recent Mortgage that was taken out on this home.
Original Mortgage
$543,750
Outstanding Balance
$353,804
Interest Rate
5.17%
Mortgage Type
Purchase Money Mortgage
Estimated Equity
$1,108,303
Purchase Details
Closed on
Apr 6, 2009
Sold by
Duncan Marc K
Bought by
Duncan Marc K
Home Financials for this Owner
Home Financials are based on the most recent Mortgage that was taken out on this home.
Original Mortgage
$70,000
Interest Rate
5.02%
Mortgage Type
Credit Line Revolving
Purchase Details
Closed on
May 16, 2006
Sold by
Vrooman Charlotte A
Bought by
Duncan Marc K
Home Financials for this Owner
Home Financials are based on the most recent Mortgage that was taken out on this home.
Original Mortgage
$445,000
Interest Rate
6.37%
Mortgage Type
Purchase Money Mortgage
Purchase Details
Closed on
Jan 13, 2005
Sold by
Duncan Marc K and Vrooman Charlotte A
Bought by
Duncan Marc K and Vrooman Charlotte A
Home Financials for this Owner
Home Financials are based on the most recent Mortgage that was taken out on this home.
Original Mortgage
$252,000
Interest Rate
5.69%
Mortgage Type
New Conventional
Purchase Details
Closed on
Aug 4, 1995
Sold by
Vrooman Duncan Marc Kenneth and Vrooman Duncan Charlotte A
Bought by
Vrooman Duncan Marc Kenneth and Vrooman Duncan Charlotte A
Home Financials for this Owner
Home Financials are based on the most recent Mortgage that was taken out on this home.
Original Mortgage
$50,000
Interest Rate
7.63%
Create a Home Valuation Report for This Property
The Home Valuation Report is an in-depth analysis detailing your home's value as well as a comparison with similar homes in the area
Home Values in the Area
Average Home Value in this Area
Purchase History
| Date | Buyer | Sale Price | Title Company |
|---|---|---|---|
| Ward Michael James | -- | None Available | |
| Ward Andrew Michael | $725,000 | Chicago Title Company | |
| Duncan Marc K | -- | North American Title Company | |
| Duncan Marc K | -- | North American Title Co | |
| Duncan Marc K | -- | First American Title Ins Co | |
| Vrooman Duncan Marc Kenneth | -- | -- |
Source: Public Records
Mortgage History
| Date | Status | Borrower | Loan Amount |
|---|---|---|---|
| Open | Ward Andrew Michael | $543,750 | |
| Previous Owner | Duncan Marc K | $70,000 | |
| Previous Owner | Duncan Marc K | $445,000 | |
| Previous Owner | Duncan Marc K | $252,000 | |
| Previous Owner | Vrooman Duncan Marc Kenneth | $50,000 |
Source: Public Records
Tax History
| Year | Tax Paid | Tax Assessment Tax Assessment Total Assessment is a certain percentage of the fair market value that is determined by local assessors to be the total taxable value of land and additions on the property. | Land | Improvement |
|---|---|---|---|---|
| 2025 | $14,066 | $928,778 | $280,733 | $655,045 |
| 2024 | $14,066 | $910,436 | $275,231 | $642,205 |
| 2023 | $13,772 | $899,448 | $269,834 | $629,614 |
| 2022 | $13,528 | $874,817 | $264,545 | $617,272 |
| 2021 | $13,561 | $857,533 | $259,360 | $605,173 |
| 2020 | $12,850 | $855,673 | $256,702 | $598,971 |
| 2019 | $12,362 | $838,897 | $251,669 | $587,228 |
| 2018 | $12,156 | $822,454 | $246,736 | $575,718 |
| 2017 | $11,731 | $806,330 | $241,899 | $564,431 |
| 2016 | $11,368 | $790,524 | $237,157 | $553,367 |
| 2015 | $11,217 | $778,657 | $233,597 | $545,060 |
| 2014 | $11,093 | $763,410 | $229,023 | $534,387 |
Source: Public Records
Map
Nearby Homes
- 2435 Bonar St
- 1135 Parker St
- 1118 Dwight Way
- 2437 Acton St
- 1431 Dwight Way
- 2703 Mathews St
- 2324 Browning St
- 2717 Mabel St
- 2423 10th St
- 1039 Channing Way
- 1516 Blake St
- 1516 Blake St Unit A
- 2350 Sacramento St
- 1524 Blake St
- 2304 Edwards St
- 2231 Byron St
- 1450 Ward St
- 1034 Grayson St
- 2750 Sacramento St
- 2758 Sacramento St