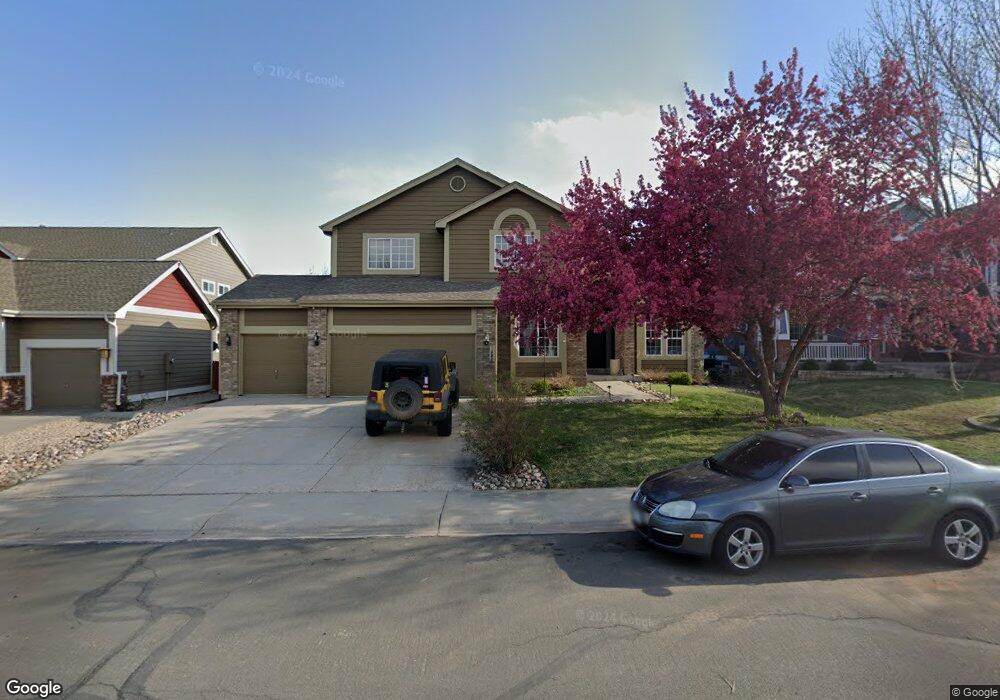
1227 Forrestal Dr Fort Collins, CO 80526
Registry Ridge NeighborhoodEstimated Value: $673,236 - $789,000
4
Beds
4
Baths
2,998
Sq Ft
$245/Sq Ft
Est. Value
About This Home
This home is located at 1227 Forrestal Dr, Fort Collins, CO 80526 and is currently estimated at $735,559, approximately $245 per square foot. 1227 Forrestal Dr is a home located in Larimer County with nearby schools including Coyote Ridge Elementary School, Lucile Erwin Middle School, and Loveland High School.
Ownership History
Date
Name
Owned For
Owner Type
Purchase Details
Closed on
Dec 13, 2019
Sold by
Gram Lori L
Bought by
Gram Lori L and Gram Jason L
Current Estimated Value
Home Financials for this Owner
Home Financials are based on the most recent Mortgage that was taken out on this home.
Original Mortgage
$110,000
Outstanding Balance
$74,896
Interest Rate
3.73%
Mortgage Type
New Conventional
Estimated Equity
$660,663
Purchase Details
Closed on
Dec 30, 2004
Sold by
Gram Jason L and Gram Lori L
Bought by
Gram Lori L
Home Financials for this Owner
Home Financials are based on the most recent Mortgage that was taken out on this home.
Original Mortgage
$244,000
Outstanding Balance
$115,964
Interest Rate
4.87%
Mortgage Type
New Conventional
Estimated Equity
$619,595
Purchase Details
Closed on
Mar 14, 2002
Sold by
U S Home Corp
Bought by
Gram Jason L and Gram Lori L
Home Financials for this Owner
Home Financials are based on the most recent Mortgage that was taken out on this home.
Original Mortgage
$244,000
Interest Rate
5.75%
Create a Home Valuation Report for This Property
The Home Valuation Report is an in-depth analysis detailing your home's value as well as a comparison with similar homes in the area
Home Values in the Area
Average Home Value in this Area
Purchase History
| Date | Buyer | Sale Price | Title Company |
|---|---|---|---|
| Gram Lori L | -- | None Available | |
| Gram Lori L | -- | -- | |
| Gram Jason L | $310,600 | -- |
Source: Public Records
Mortgage History
| Date | Status | Borrower | Loan Amount |
|---|---|---|---|
| Open | Gram Lori L | $110,000 | |
| Open | Gram Lori L | $244,000 | |
| Closed | Gram Jason L | $244,000 | |
| Closed | Gram Lori L | $105,000 |
Source: Public Records
Tax History Compared to Growth
Tax History
| Year | Tax Paid | Tax Assessment Tax Assessment Total Assessment is a certain percentage of the fair market value that is determined by local assessors to be the total taxable value of land and additions on the property. | Land | Improvement |
|---|---|---|---|---|
| 2025 | $3,601 | $45,935 | $4,020 | $41,915 |
| 2024 | $3,483 | $45,935 | $4,020 | $41,915 |
| 2022 | $2,962 | $34,792 | $4,170 | $30,622 |
| 2021 | $3,047 | $35,793 | $4,290 | $31,503 |
| 2020 | $3,142 | $36,908 | $4,290 | $32,618 |
| 2019 | $3,092 | $36,908 | $4,290 | $32,618 |
| 2018 | $2,926 | $33,271 | $4,320 | $28,951 |
| 2017 | $2,546 | $33,271 | $4,320 | $28,951 |
| 2016 | $2,383 | $30,160 | $4,776 | $25,384 |
| 2015 | $2,364 | $30,160 | $4,780 | $25,380 |
| 2014 | $2,188 | $27,060 | $4,780 | $22,280 |
Source: Public Records
Map
Nearby Homes
- 1226 Reeves Dr
- 1340 Leahy Dr
- 1426 Reeves Dr
- 7003 Sculpin Ct
- 7014 Shangri-La Ct
- 7127 Ranger Dr
- 6701 Holyoke Ct
- 7321 S Shields St
- 1232 Meeteetse Ln
- 530 Holyoke Ct
- 7202 Fort Morgan Dr
- 402 Hudson Ct
- 320 Strasburg Dr Unit B10
- 602 Peyton Dr
- 7008 Woodrow Dr
- 301 Uranus St
- 7368 New Raymer Ct
- 225 W Trilby Rd
- 7421 Triangle Dr
- 217 W Trilby Rd
- 1221 Forrestal Dr
- 1233 Forrestal Dr
- 1226 Truxtun Dr
- 1232 Truxtun Dr
- 1220 Truxtun Dr
- 1215 Forrestal Dr
- 1214 Truxtun Dr
- 1226 Forrestal Dr
- 1232 Forrestal Dr
- 1220 Forrestal Dr
- 1303 Forrestal Dr
- 1209 Forrestal Dr
- 1302 Truxtun Dr
- 1215 Truxun Dr
- 1208 Truxtun Dr
- 1214 Forrestal Dr
- 1233 Truxtun Dr
- 1309 Forrestal Dr
- 1302 Forrestal Dr
- 1227 Truxtun Dr