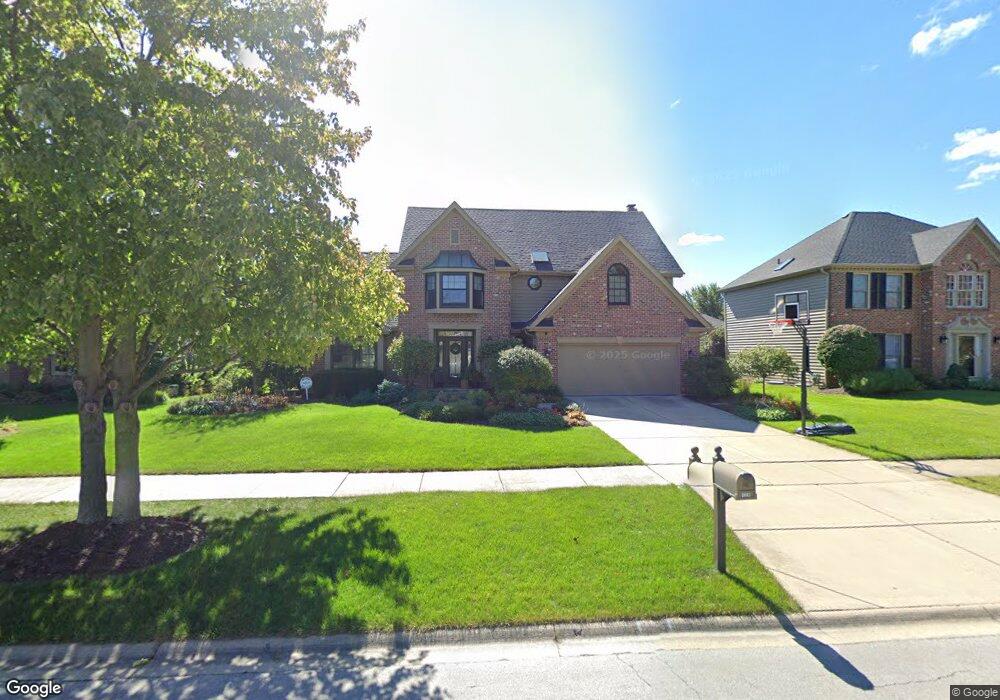
1228 Thackery Ct Unit 6 Naperville, IL 60564
Ashbury NeighborhoodEstimated Value: $709,080 - $811,000
--
Bed
--
Bath
2,920
Sq Ft
$262/Sq Ft
Est. Value
About This Home
This home is located at 1228 Thackery Ct Unit 6, Naperville, IL 60564 and is currently estimated at $764,020, approximately $261 per square foot. 1228 Thackery Ct Unit 6 is a home located in Will County with nearby schools including Ellsworth Elementary School, Gordon Gregory Middle School, and Neuqua Valley High School.
Ownership History
Date
Name
Owned For
Owner Type
Purchase Details
Closed on
Sep 29, 2003
Sold by
Cianci Gary and Cianci Jennifer
Bought by
Snyder Matthew D and Snyder Jorie S
Current Estimated Value
Home Financials for this Owner
Home Financials are based on the most recent Mortgage that was taken out on this home.
Original Mortgage
$322,700
Outstanding Balance
$152,860
Interest Rate
6.43%
Mortgage Type
Purchase Money Mortgage
Estimated Equity
$611,160
Purchase Details
Closed on
Mar 24, 1994
Sold by
Classic Custom Homes Inc
Bought by
Brinker W Todd and Brinker Michelle C
Home Financials for this Owner
Home Financials are based on the most recent Mortgage that was taken out on this home.
Original Mortgage
$220,000
Interest Rate
7.17%
Create a Home Valuation Report for This Property
The Home Valuation Report is an in-depth analysis detailing your home's value as well as a comparison with similar homes in the area
Home Values in the Area
Average Home Value in this Area
Purchase History
| Date | Buyer | Sale Price | Title Company |
|---|---|---|---|
| Snyder Matthew D | $430,000 | Ticor Title | |
| Brinker W Todd | $275,000 | First American Title Insuran |
Source: Public Records
Mortgage History
| Date | Status | Borrower | Loan Amount |
|---|---|---|---|
| Open | Snyder Matthew D | $322,700 | |
| Previous Owner | Brinker W Todd | $220,000 |
Source: Public Records
Tax History Compared to Growth
Tax History
| Year | Tax Paid | Tax Assessment Tax Assessment Total Assessment is a certain percentage of the fair market value that is determined by local assessors to be the total taxable value of land and additions on the property. | Land | Improvement |
|---|---|---|---|---|
| 2024 | $12,976 | $206,106 | $65,131 | $140,975 |
| 2023 | $12,976 | $182,072 | $57,536 | $124,536 |
| 2022 | $12,372 | $171,464 | $54,428 | $117,036 |
| 2021 | $11,290 | $163,299 | $51,836 | $111,463 |
| 2020 | $11,073 | $160,712 | $51,015 | $109,697 |
| 2019 | $10,878 | $156,182 | $49,577 | $106,605 |
| 2018 | $11,052 | $153,539 | $48,487 | $105,052 |
| 2017 | $10,883 | $149,575 | $47,235 | $102,340 |
| 2016 | $10,863 | $146,355 | $46,218 | $100,137 |
| 2015 | $11,036 | $140,726 | $44,440 | $96,286 |
| 2014 | $11,036 | $137,966 | $44,440 | $93,526 |
| 2013 | $11,036 | $137,966 | $44,440 | $93,526 |
Source: Public Records
Map
Nearby Homes
- 2741 Gateshead Dr
- 1300 Leawood Ct
- 1123 Thackery Ln
- 3212 Austin Ct
- 3004 Bennett Dr
- 1116 Hollingswood Ave
- 3432 Caine Dr
- 1305 Morningstar Ct Unit 1A
- 945 Winners Cup Ct Unit 945
- 3508 Tussell St
- 1134 Gateshead Dr
- 2949 Brossman St
- 2636 Salix Cir
- 28W555 Leverenz Rd
- 3616 Eliot Ln
- 1329 Neskola Ct
- 1321 Galena Ct
- 1112 Saratoga Ct
- 3816 Rosada Dr
- 2301 Mecan Dr
- 1224 Thackery Ct
- 1232 Thackery Ct
- 1227 Cromwell Ln
- 1223 Cromwell Ln
- 1231 Cromwell Ln
- 1220 Thackery Ct Unit 6
- 1236 Thackery Ct
- 1220 Thackery Ct
- 1227 Thackery Ct
- 1219 Cromwell Ln
- 1231 Thackery Ct
- 1235 Cromwell Ln
- 1223 Thackery Ct
- 1216 Thackery Ct
- 1235 Thackery Ct
- 1240 Thackery Ct
- 1219 Thackery Ct
- 1215 Cromwell Ln
- 1239 Cromwell Ln