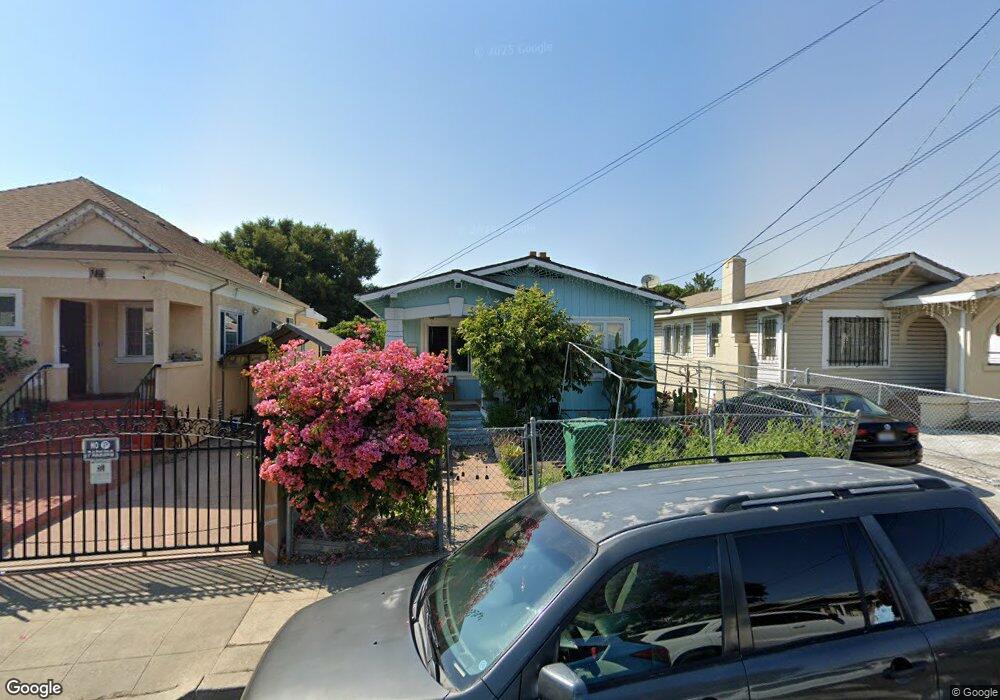
1229 54th Ave Oakland, CA 94601
Melrose NeighborhoodEstimated Value: $384,012 - $489,000
2
Beds
1
Bath
840
Sq Ft
$536/Sq Ft
Est. Value
About This Home
This home is located at 1229 54th Ave, Oakland, CA 94601 and is currently estimated at $450,253, approximately $536 per square foot. 1229 54th Ave is a home located in Alameda County with nearby schools including Bridges Academy Elementary School, Greenleaf Elementary School, and Coliseum College Prep Academy.
Ownership History
Date
Name
Owned For
Owner Type
Purchase Details
Closed on
Dec 21, 2015
Sold by
Wu Eric Minh and Wu Michele K
Bought by
Eric Minh Wu & Michele K Wu Revocable Tr
Current Estimated Value
Purchase Details
Closed on
May 8, 1998
Sold by
Tam Cheuk Y and Tam Mei M
Bought by
Wu Eric M and Wu Michele K
Home Financials for this Owner
Home Financials are based on the most recent Mortgage that was taken out on this home.
Original Mortgage
$62,400
Outstanding Balance
$12,224
Interest Rate
7.13%
Estimated Equity
$438,029
Create a Home Valuation Report for This Property
The Home Valuation Report is an in-depth analysis detailing your home's value as well as a comparison with similar homes in the area
Home Values in the Area
Average Home Value in this Area
Purchase History
| Date | Buyer | Sale Price | Title Company |
|---|---|---|---|
| Eric Minh Wu & Michele K Wu Revocable Tr | -- | None Available | |
| Wu Eric M | $78,000 | Fidelity National Title Co |
Source: Public Records
Mortgage History
| Date | Status | Borrower | Loan Amount |
|---|---|---|---|
| Open | Wu Eric M | $62,400 |
Source: Public Records
Tax History
| Year | Tax Paid | Tax Assessment Tax Assessment Total Assessment is a certain percentage of the fair market value that is determined by local assessors to be the total taxable value of land and additions on the property. | Land | Improvement |
|---|---|---|---|---|
| 2025 | $3,387 | $124,539 | $36,723 | $87,816 |
| 2024 | $3,387 | $122,098 | $36,003 | $86,095 |
| 2023 | $3,440 | $119,704 | $35,297 | $84,407 |
| 2022 | $3,284 | $117,357 | $34,605 | $82,752 |
| 2021 | $2,997 | $115,056 | $33,927 | $81,129 |
| 2020 | $2,962 | $113,877 | $33,579 | $80,298 |
| 2019 | $2,761 | $111,645 | $32,921 | $78,724 |
| 2018 | $2,708 | $109,455 | $32,275 | $77,180 |
| 2017 | $2,572 | $107,309 | $31,642 | $75,667 |
| 2016 | $2,401 | $105,206 | $31,022 | $74,184 |
| 2015 | $2,385 | $103,626 | $30,556 | $73,070 |
| 2014 | $2,306 | $101,597 | $29,958 | $71,639 |
Source: Public Records
Map
Nearby Homes
- 1024 50th Ave
- 1517 51st Ave
- 1433 56th Ave
- 1618 51st Ave
- 1244 58th Ave
- 5440 Wadean Place
- 1519 48th Ave
- 1301 60th Ave
- 1321 60th Ave
- 5116 Bancroft Ave
- 5715 E 16th St
- 1620 46th Ave
- 1130 61st Ave
- 5910 International Blvd
- 4709 Foothill Blvd
- 5914 International Blvd
- 1432 45th Ave
- 1243 62nd Ave
- 1919 48th Ave
- 1826 Vicksburg Ave Unit 1
Your Personal Tour Guide
Ask me questions while you tour the home.