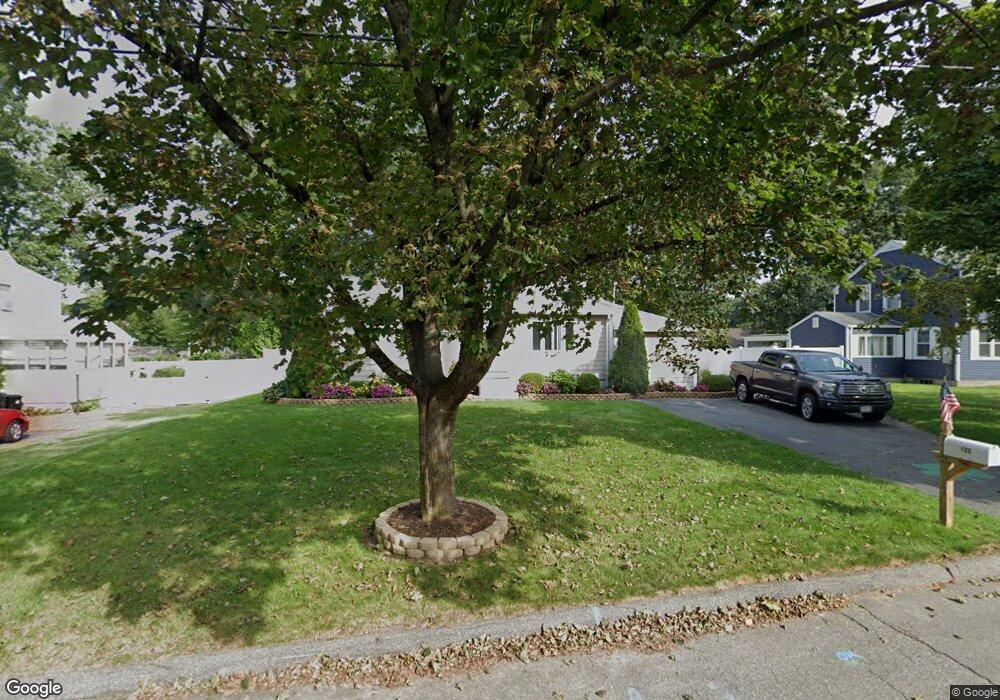
123 Donbray Rd Springfield, MA 01119
Sixteen Acres NeighborhoodEstimated Value: $330,000 - $419,000
2
Beds
2
Baths
2,112
Sq Ft
$176/Sq Ft
Est. Value
About This Home
This home is located at 123 Donbray Rd, Springfield, MA 01119 and is currently estimated at $372,287, approximately $176 per square foot. 123 Donbray Rd is a home located in Hampden County with nearby schools including Glickman Elementary, John J Duggan Middle, and Springfield High School of Science and Technology.
Ownership History
Date
Name
Owned For
Owner Type
Purchase Details
Closed on
Jul 13, 2001
Sold by
Keddy James R and Keddy Carol A
Bought by
Corris Maria D
Current Estimated Value
Home Financials for this Owner
Home Financials are based on the most recent Mortgage that was taken out on this home.
Original Mortgage
$76,000
Outstanding Balance
$29,416
Interest Rate
7.2%
Mortgage Type
Purchase Money Mortgage
Estimated Equity
$342,871
Create a Home Valuation Report for This Property
The Home Valuation Report is an in-depth analysis detailing your home's value as well as a comparison with similar homes in the area
Home Values in the Area
Average Home Value in this Area
Purchase History
| Date | Buyer | Sale Price | Title Company |
|---|---|---|---|
| Corris Maria D | $116,000 | -- |
Source: Public Records
Mortgage History
| Date | Status | Borrower | Loan Amount |
|---|---|---|---|
| Open | Corris Maria D | $76,000 | |
| Previous Owner | Corris Maria D | $72,000 |
Source: Public Records
Tax History
| Year | Tax Paid | Tax Assessment Tax Assessment Total Assessment is a certain percentage of the fair market value that is determined by local assessors to be the total taxable value of land and additions on the property. | Land | Improvement |
|---|---|---|---|---|
| 2025 | $5,742 | $366,200 | $52,800 | $313,400 |
| 2024 | $5,245 | $326,600 | $52,800 | $273,800 |
| 2023 | $3,736 | $219,100 | $50,300 | $168,800 |
| 2022 | $3,472 | $184,500 | $50,300 | $134,200 |
| 2021 | $3,340 | $176,700 | $45,700 | $131,000 |
| 2020 | $3,308 | $169,400 | $45,700 | $123,700 |
| 2019 | $3,243 | $164,800 | $45,700 | $119,100 |
| 2018 | $3,186 | $161,900 | $45,700 | $116,200 |
| 2017 | $3,049 | $155,100 | $45,600 | $109,500 |
| 2016 | $2,929 | $149,000 | $45,600 | $103,400 |
| 2015 | $2,787 | $141,700 | $45,600 | $96,100 |
Source: Public Records
Map
Nearby Homes
- 381 N Brook Rd
- 235 Starling Rd
- 186 Bolton St
- Lot 37 Kane St
- 108 Birchland Ave
- 38 Northway Dr
- 46 Puritan Cir
- 121 Mallowhill Rd
- 244 Nassau Dr Unit 244
- 25 Nassau Dr Unit 25
- 173 Nassau Dr
- 854 Grayson Dr
- 88 Senator St
- 56 Rosemary Dr
- 130 Spear Rd
- 73 Timber Ln
- 56 Contessa Ln
- 19 Annies Way
- 74 Valley Rd
- 322 Gilbert Ave
Your Personal Tour Guide
Ask me questions while you tour the home.