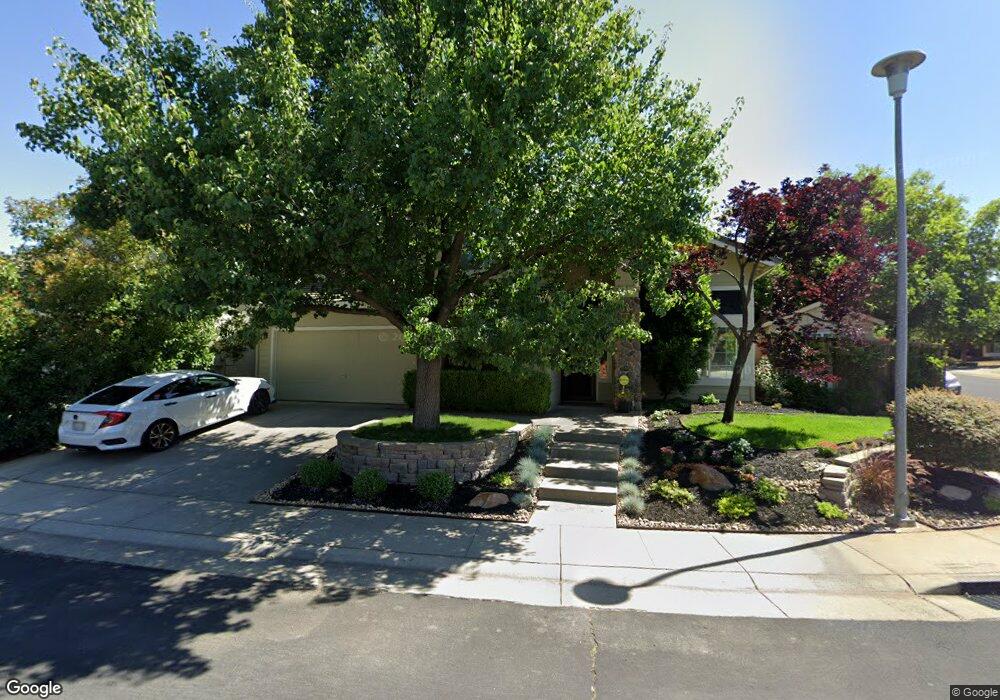
123 Foley Ln Folsom, CA 95630
Estimated Value: $674,215 - $723,000
4
Beds
3
Baths
1,938
Sq Ft
$358/Sq Ft
Est. Value
About This Home
This home is located at 123 Foley Ln, Folsom, CA 95630 and is currently estimated at $693,804, approximately $358 per square foot. 123 Foley Ln is a home located in Sacramento County with nearby schools including Theodore Judah Elementary School, Sutter Middle School, and Folsom High School.
Ownership History
Date
Name
Owned For
Owner Type
Purchase Details
Closed on
Jan 14, 2016
Sold by
Roberts Craig James and Roberts Kristin Michelle
Bought by
Roberts Craig James and Roberts Kristin Michelle
Current Estimated Value
Home Financials for this Owner
Home Financials are based on the most recent Mortgage that was taken out on this home.
Original Mortgage
$229,000
Outstanding Balance
$97,155
Interest Rate
3.92%
Mortgage Type
New Conventional
Estimated Equity
$596,649
Purchase Details
Closed on
Aug 12, 2002
Sold by
Roberts Craig James
Bought by
Michelle Roberts Craig James and Michelle Torchoa Kristin
Purchase Details
Closed on
Feb 21, 2002
Sold by
Roberts J Brooke
Bought by
Roberts Craige
Purchase Details
Closed on
Oct 10, 2001
Sold by
Lakemont Folsom Llc
Bought by
Roberts Craig and Brooke Roberts J
Home Financials for this Owner
Home Financials are based on the most recent Mortgage that was taken out on this home.
Original Mortgage
$215,500
Interest Rate
6.91%
Create a Home Valuation Report for This Property
The Home Valuation Report is an in-depth analysis detailing your home's value as well as a comparison with similar homes in the area
Purchase History
| Date | Buyer | Sale Price | Title Company |
|---|---|---|---|
| Roberts Craig James | -- | Old Republic Title Company | |
| Michelle Roberts Craig James | -- | -- | |
| Roberts Craige | -- | -- | |
| Roberts Craig | $227,000 | Old Republic Title Company |
Source: Public Records
Mortgage History
| Date | Status | Borrower | Loan Amount |
|---|---|---|---|
| Open | Roberts Craig James | $229,000 | |
| Closed | Roberts Craig | $215,500 |
Source: Public Records
Tax History
| Year | Tax Paid | Tax Assessment Tax Assessment Total Assessment is a certain percentage of the fair market value that is determined by local assessors to be the total taxable value of land and additions on the property. | Land | Improvement |
|---|---|---|---|---|
| 2025 | $3,816 | $346,601 | $88,625 | $257,976 |
| 2024 | $3,816 | $339,806 | $86,888 | $252,918 |
| 2023 | $3,750 | $333,144 | $85,185 | $247,959 |
| 2022 | $3,697 | $326,613 | $83,515 | $243,098 |
| 2021 | $3,650 | $320,210 | $81,878 | $238,332 |
| 2020 | $3,606 | $316,928 | $81,039 | $235,889 |
| 2019 | $3,548 | $310,714 | $79,450 | $231,264 |
| 2018 | $3,462 | $304,623 | $77,893 | $226,730 |
| 2017 | $3,957 | $298,651 | $76,366 | $222,285 |
| 2016 | $4,082 | $292,796 | $74,869 | $217,927 |
| 2015 | $3,977 | $288,399 | $73,745 | $214,654 |
| 2014 | $3,821 | $282,751 | $72,301 | $210,450 |
Source: Public Records
Map
Nearby Homes
- 115 McNamee Dr
- 1002 Sibley St Unit 25
- 206 Oxburough Dr
- 467 Facet Place
- 503 Diamond Glen Cir
- 108 Austin Dr
- 701 Ferrier Way
- 448 Gem Smith Place
- 682 Diamond Glen Cir
- 692 Humbert St
- 607 Sibley St
- 683 Loomis Cir
- 611 Mormon St
- 306 Dean Way
- 900 Figueroa St Unit B
- 219 Needles Way
- 112 Hazelmere Dr
- 182 Price Way
- 115 Chesterfield Way
- 98-98 1/2 Dean Way
- 121 Foley Ln
- 145 Gilded Rock Cir
- 147 Gilded Rock Cir
- 119 Foley Ln
- 140 Gilded Rock Cir
- 138 Gilded Rock Cir
- 122 Foley Ln
- 120 Foley Ln
- 149 Gilded Rock Cir
- 142 Gilded Rock Cir
- 118 Foley Ln
- 136 Gilded Rock Cir
- 117 Foley Ln
- 151 Gilded Rock Cir
- 116 Foley Ln
- 123 Gilded Rock Cir
- 125 Gilded Rock Cir
- 130 Rockbolt Cir
- 128 Rockbolt Cir
- 134 Gilded Rock Cir
Your Personal Tour Guide
Ask me questions while you tour the home.