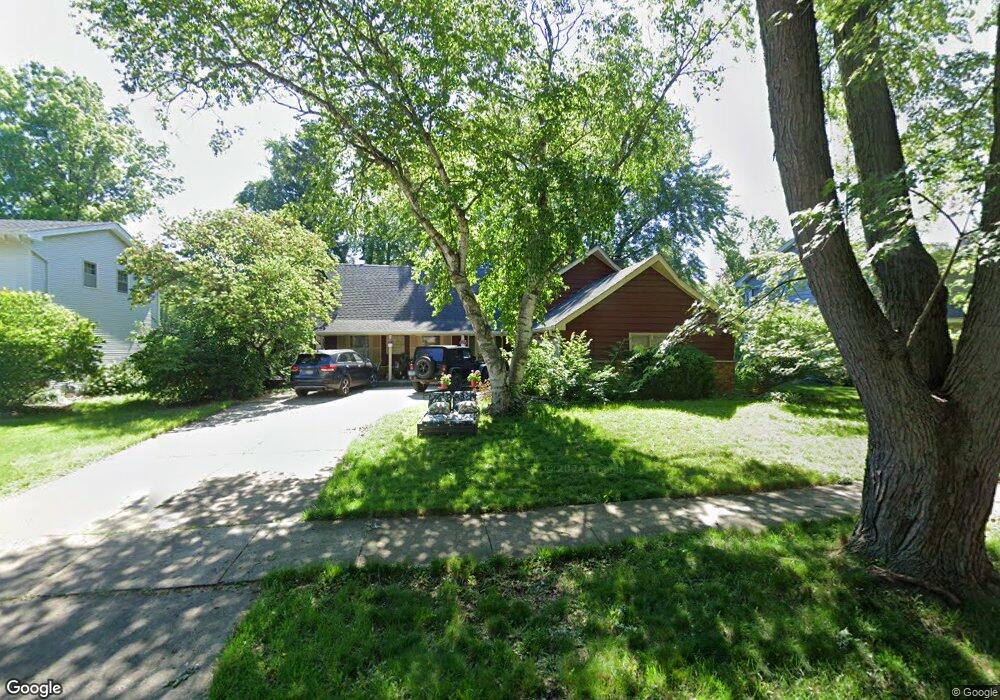
1232 Hercules Ln Naperville, IL 60540
West Highlands NeighborhoodEstimated Value: $588,061 - $648,000
4
Beds
3
Baths
2,323
Sq Ft
$266/Sq Ft
Est. Value
About This Home
This home is located at 1232 Hercules Ln, Naperville, IL 60540 and is currently estimated at $617,765, approximately $265 per square foot. 1232 Hercules Ln is a home located in DuPage County with nearby schools including Elmwood Elementary School, Lincoln Jr. High School, and Naperville Central High School.
Ownership History
Date
Name
Owned For
Owner Type
Purchase Details
Closed on
Oct 14, 2004
Sold by
Hook Steven R and Nelson Hook Suzanne
Bought by
Khant Neil B
Current Estimated Value
Home Financials for this Owner
Home Financials are based on the most recent Mortgage that was taken out on this home.
Original Mortgage
$288,720
Outstanding Balance
$200,287
Interest Rate
4.62%
Mortgage Type
Purchase Money Mortgage
Estimated Equity
$417,478
Purchase Details
Closed on
Jan 7, 2002
Sold by
Hook Jennifer Lynn
Bought by
Hook Steven Richard
Purchase Details
Closed on
Mar 28, 2000
Sold by
Million Donald M and Million Doreen K
Bought by
Hook Stven R and Hook Jennifer L
Home Financials for this Owner
Home Financials are based on the most recent Mortgage that was taken out on this home.
Original Mortgage
$200,000
Interest Rate
8.39%
Create a Home Valuation Report for This Property
The Home Valuation Report is an in-depth analysis detailing your home's value as well as a comparison with similar homes in the area
Home Values in the Area
Average Home Value in this Area
Purchase History
| Date | Buyer | Sale Price | Title Company |
|---|---|---|---|
| Khant Neil B | $361,000 | First American Title Ins Co | |
| Hook Steven Richard | -- | -- | |
| Hook Stven R | $255,000 | First American Title Ins |
Source: Public Records
Mortgage History
| Date | Status | Borrower | Loan Amount |
|---|---|---|---|
| Open | Khant Neil B | $288,720 | |
| Previous Owner | Hook Stven R | $200,000 | |
| Closed | Khant Neil B | $36,090 |
Source: Public Records
Tax History Compared to Growth
Tax History
| Year | Tax Paid | Tax Assessment Tax Assessment Total Assessment is a certain percentage of the fair market value that is determined by local assessors to be the total taxable value of land and additions on the property. | Land | Improvement |
|---|---|---|---|---|
| 2024 | $10,329 | $176,605 | $76,217 | $100,388 |
| 2023 | $9,953 | $161,180 | $69,560 | $91,620 |
| 2022 | $9,334 | $150,220 | $64,830 | $85,390 |
| 2021 | $8,993 | $144,540 | $62,380 | $82,160 |
| 2020 | $8,801 | $141,940 | $61,260 | $80,680 |
| 2019 | $8,544 | $135,800 | $58,610 | $77,190 |
| 2018 | $8,032 | $128,000 | $57,180 | $70,820 |
| 2017 | $7,870 | $123,680 | $55,250 | $68,430 |
| 2016 | $7,711 | $119,210 | $53,250 | $65,960 |
| 2015 | $7,660 | $112,260 | $50,150 | $62,110 |
| 2014 | $7,746 | $110,060 | $49,170 | $60,890 |
| 2013 | $7,630 | $110,330 | $49,290 | $61,040 |
Source: Public Records
Map
Nearby Homes
- 165 Tamarack Ave
- 344 Waxwing Ave
- 425 W Gartner Rd
- 1443 Meander Dr
- 213 Winding Creek Dr
- 1408 Swallow St
- 225 Elmwood Dr
- 908 Julian Ct
- 132 Robin Hill Dr
- 316 Hemlock Ln
- 845 Tulip Ln
- 911 Lilac Ln Unit 9
- 616 Driftwood Ct
- 821 Wellner Rd
- 1033 Emerald Dr
- 923 Tim Tam Cir
- 31 Golden Larch Ct
- 325 Pine Ct
- 907 Secretariat Dr
- 706 S Loomis St Unit D
- 1228 Hercules Ln
- 1236 Hercules Ln
- 1233 Catalpa Ln
- 1237 Catalpa Ln
- 1224 Hercules Ln
- 1229 Hercules Ln
- 1229 Catalpa Ln
- 213 Tupelo Ave
- 1233 Hercules Ln
- 1237 Hercules Ln
- 209 Tupelo Ave
- 1241 Catalpa Ln
- 1225 Hercules Ln
- 1220 Hercules Ln
- 1225 Catalpa Ln
- 1241 Hercules Ln
- 1221 Hercules Ln
- 1236 Catalpa Ln
- 1232 Atlas Ln
- 1232 Catalpa Ln