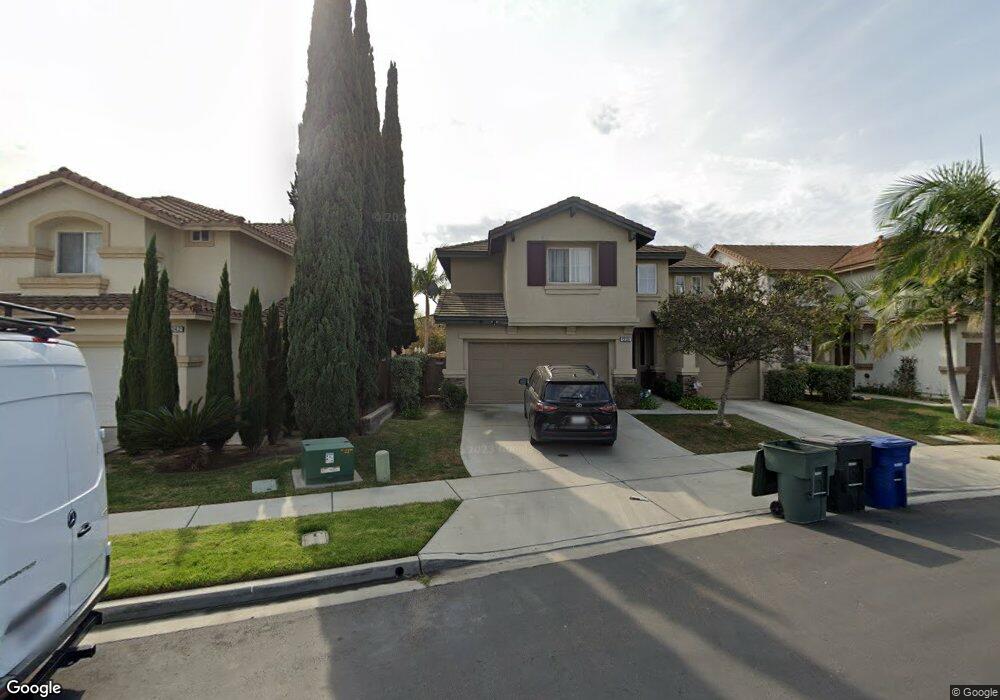
1238 Visalia Ct Chula Vista, CA 91913
Otay Ranch Village NeighborhoodEstimated Value: $964,962 - $1,033,000
4
Beds
3
Baths
2,233
Sq Ft
$452/Sq Ft
Est. Value
About This Home
This home is located at 1238 Visalia Ct, Chula Vista, CA 91913 and is currently estimated at $1,008,741, approximately $451 per square foot. 1238 Visalia Ct is a home located in San Diego County with nearby schools including Heritage Elementary School, Rancho Del Rey Middle School, and Otay Ranch Senior High School.
Ownership History
Date
Name
Owned For
Owner Type
Purchase Details
Closed on
Jul 21, 2004
Sold by
Romero Jose L and Romero Virginia N
Bought by
Romero Jose L and Romero Virginia N
Current Estimated Value
Home Financials for this Owner
Home Financials are based on the most recent Mortgage that was taken out on this home.
Original Mortgage
$333,700
Outstanding Balance
$167,474
Interest Rate
6.29%
Mortgage Type
Stand Alone Refi Refinance Of Original Loan
Estimated Equity
$841,267
Purchase Details
Closed on
Mar 30, 2000
Sold by
Standard Pacific Corp
Bought by
Romero Jose L and Romero Virginia Nuno
Home Financials for this Owner
Home Financials are based on the most recent Mortgage that was taken out on this home.
Original Mortgage
$242,150
Interest Rate
8.67%
Create a Home Valuation Report for This Property
The Home Valuation Report is an in-depth analysis detailing your home's value as well as a comparison with similar homes in the area
Home Values in the Area
Average Home Value in this Area
Purchase History
| Date | Buyer | Sale Price | Title Company |
|---|---|---|---|
| Romero Jose L | -- | Chicago Title Co | |
| Romero Jose L | $255,000 | Chicago Title |
Source: Public Records
Mortgage History
| Date | Status | Borrower | Loan Amount |
|---|---|---|---|
| Open | Romero Jose L | $333,700 | |
| Previous Owner | Romero Jose L | $242,150 |
Source: Public Records
Tax History Compared to Growth
Tax History
| Year | Tax Paid | Tax Assessment Tax Assessment Total Assessment is a certain percentage of the fair market value that is determined by local assessors to be the total taxable value of land and additions on the property. | Land | Improvement |
|---|---|---|---|---|
| 2025 | $5,697 | $391,755 | $130,634 | $261,121 |
| 2024 | $5,697 | $384,074 | $128,073 | $256,001 |
| 2023 | $7,428 | $376,544 | $125,562 | $250,982 |
| 2022 | $7,229 | $369,161 | $123,100 | $246,061 |
| 2021 | $7,083 | $361,924 | $120,687 | $241,237 |
| 2020 | $6,928 | $358,214 | $119,450 | $238,764 |
| 2019 | $6,764 | $351,191 | $117,108 | $234,083 |
| 2018 | $6,646 | $344,306 | $114,812 | $229,494 |
| 2017 | $6,518 | $337,556 | $112,561 | $224,995 |
| 2016 | $6,286 | $330,938 | $110,354 | $220,584 |
| 2015 | $6,113 | $325,968 | $108,697 | $217,271 |
| 2014 | $5,989 | $319,583 | $106,568 | $213,015 |
Source: Public Records
Map
Nearby Homes
- 1209 Morgan Hill Dr
- 1340 Monte Sereno Ave
- 1236 El Cortez Ct
- 1284 Saint Helena Ave
- 1402 Antioch Ave
- 1377 Stoney Spring Ct
- 1181 De Soto Ct Unit 54
- 1175 Santa Olivia Rd
- 1156 Tristan River Rd
- 1411 Santa Rita E
- 1075 Hayuco Plaza
- 1060 Via Sinuoso
- 1057 Paseo Del Norte
- 1236 Bolinas Bay Ct
- 1272 Santa Lucia Rd
- 1337 Santa Olivia Rd
- 1518 Piedmont St
- 1532 Painted Cave Ave
- 1112 Camino Del Rey
- 1457 Carpinteria St
- 1234 Visalia Ct
- 1242 Visalia Ct
- 1230 Visalia Ct
- 1246 Visalia Ct
- 1261 Santa Ynez Ave
- 1257 Santa Ynez Ave
- 1226 Visalia Ct
- 1265 Santa Ynez Ave
- 1250 Visalia Ct
- 1253 Santa Ynez Ave
- 1269 Santa Ynez Ave
- 1243 Visalia Ct
- 1239 Visalia Ct
- 1235 Visalia Ct
- 1249 Santa Ynez Ave
- 1247 Visalia Ct
- 1251 Visalia Ct
- 1245 Santa Ynez Ave
- 1271 Santa Ynez Ave
- 1245 Lindsay St