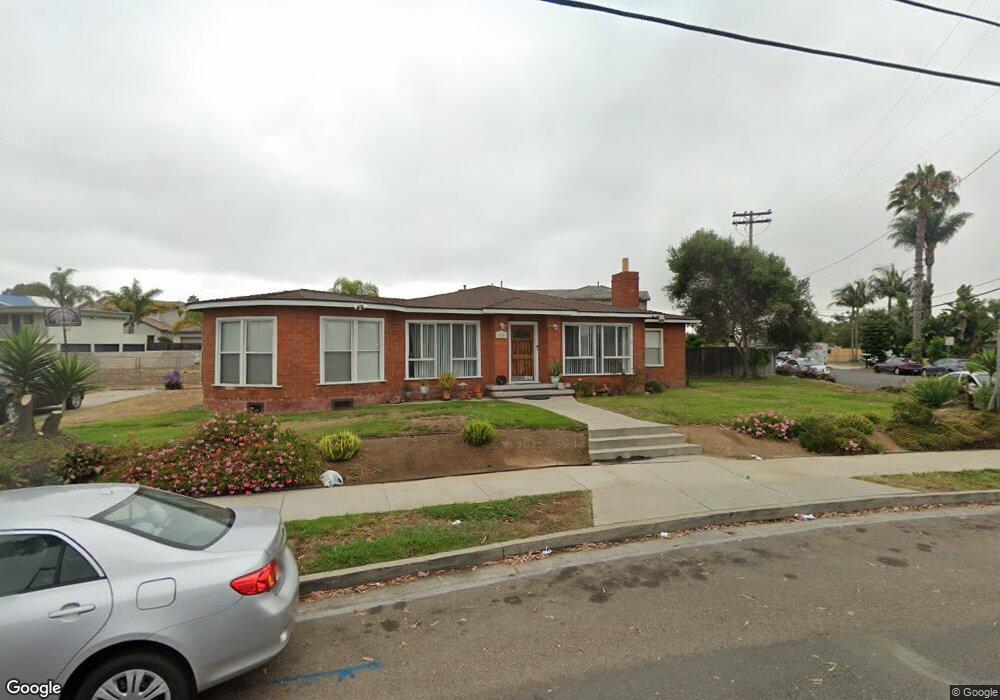
124 Barnes St Oceanside, CA 92054
Loma Alta NeighborhoodEstimated Value: $966,823 - $1,064,000
3
Beds
1
Bath
1,523
Sq Ft
$661/Sq Ft
Est. Value
About This Home
This home is located at 124 Barnes St, Oceanside, CA 92054 and is currently estimated at $1,005,956, approximately $660 per square foot. 124 Barnes St is a home located in San Diego County with nearby schools including Mission Elementary School, Oceanside High School, and St. Mary Star Of The Sea Elementary School.
Ownership History
Date
Name
Owned For
Owner Type
Purchase Details
Closed on
Dec 20, 2012
Sold by
Slawson Grant and Mccaffery Victoria
Bought by
Rooster House Limited Partnership
Current Estimated Value
Purchase Details
Closed on
Oct 25, 2012
Sold by
Slawson Grant and Mccaffery Victoria
Bought by
Slawson Grant and Mccaffery Victoria
Purchase Details
Closed on
May 16, 1996
Sold by
Singh Jaspaul and Singh Satinder K
Bought by
Slawson Grant and Mccaffery Victoria
Home Financials for this Owner
Home Financials are based on the most recent Mortgage that was taken out on this home.
Original Mortgage
$75,000
Interest Rate
7.8%
Purchase Details
Closed on
Oct 24, 1990
Create a Home Valuation Report for This Property
The Home Valuation Report is an in-depth analysis detailing your home's value as well as a comparison with similar homes in the area
Home Values in the Area
Average Home Value in this Area
Purchase History
| Date | Buyer | Sale Price | Title Company |
|---|---|---|---|
| Rooster House Limited Partnership | -- | None Available | |
| Slawson Grant | -- | None Available | |
| Rooster House Limited Partnership | -- | None Available | |
| Slawson Grant | $75,000 | Old Republic Title Company | |
| -- | $185,000 | -- |
Source: Public Records
Mortgage History
| Date | Status | Borrower | Loan Amount |
|---|---|---|---|
| Previous Owner | Slawson Grant | $75,000 |
Source: Public Records
Tax History
| Year | Tax Paid | Tax Assessment Tax Assessment Total Assessment is a certain percentage of the fair market value that is determined by local assessors to be the total taxable value of land and additions on the property. | Land | Improvement |
|---|---|---|---|---|
| 2025 | $1,390 | $122,124 | $105,851 | $16,273 |
| 2024 | $1,390 | $119,730 | $103,776 | $15,954 |
| 2023 | $1,347 | $117,384 | $101,742 | $15,642 |
| 2022 | $1,327 | $115,084 | $99,748 | $15,336 |
| 2021 | $1,332 | $112,829 | $97,793 | $15,036 |
| 2020 | $1,292 | $111,673 | $96,791 | $14,882 |
| 2019 | $1,256 | $109,485 | $94,894 | $14,591 |
| 2018 | $1,242 | $107,339 | $93,034 | $14,305 |
| 2017 | $1,220 | $105,235 | $91,210 | $14,025 |
| 2016 | $1,180 | $103,172 | $89,422 | $13,750 |
| 2015 | $1,146 | $101,623 | $88,079 | $13,544 |
| 2014 | $1,104 | $99,633 | $86,354 | $13,279 |
Source: Public Records
Map
Nearby Homes
- 1432 Buena St
- 1328 Buena St
- 415 Stoney Point Way Unit 106
- 2309 Saratoga St
- 168 Carey Rd
- 1330 Bush St
- 426 Grant St
- 509 Rockledge St
- 420 Stoney Point Way Unit 113
- 430 Stoney Point Way Unit 124
- 520 Grant St
- 503 505 N Nevada St
- 722 &718 N Freeman St
- 415 S Weitzel St
- 506 Canyon Dr Unit 6
- 0 Amick St Unit 146-100-23-00, 21, 1
- 1100 Civic Center Dr Unit C25
- 2721 Lomita St
- 421 N Weitzel St
- 426 S Nevada St
- 1740 Dixie St
- 1744 Dixie St
- 1748 Dixie St
- 120 Barnes St
- 1755 Ragtime Way
- 1759 Ragtime Way
- 1752 Dixie St
- 1763 Ragtime Way
- 1701 Dixie St
- 1771 Ragtime Way
- 1709 Dixie St
- 1715 Dixie St
- 1756 Dixie St
- 230 Barnes St
- 1760 Dixie St
- 1750 Ragtime Way
- 1754 Ragtime Way
- 1758 Ragtime Way
- 1764 Dixie St
- 1762 Ragtime Way
Your Personal Tour Guide
Ask me questions while you tour the home.