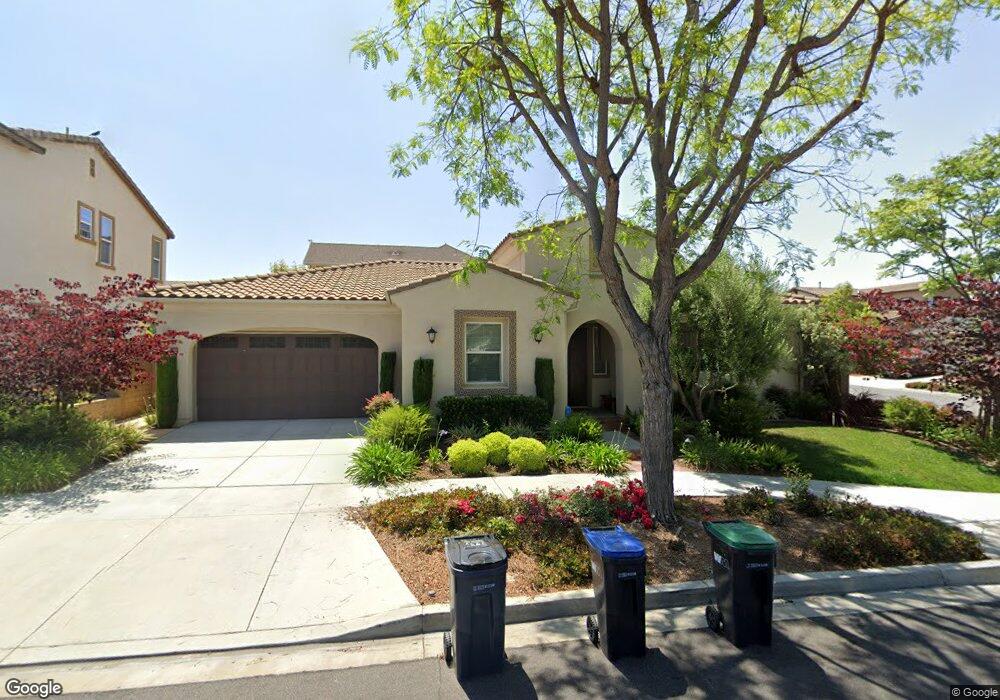
124 Compass Irvine, CA 92618
Great Park NeighborhoodEstimated Value: $1,660,555 - $2,124,000
3
Beds
2
Baths
1,746
Sq Ft
$1,105/Sq Ft
Est. Value
About This Home
This home is located at 124 Compass, Irvine, CA 92618 and is currently estimated at $1,929,389, approximately $1,105 per square foot. 124 Compass is a home with nearby schools including Beacon Park, Portola High School, and Woodbury Elementary School.
Ownership History
Date
Name
Owned For
Owner Type
Purchase Details
Closed on
Apr 16, 2015
Sold by
Chong Jimmy Tze Sheun
Bought by
Chong Tze Sheun and Jimmy Chong Individual Trust
Current Estimated Value
Purchase Details
Closed on
Nov 14, 2013
Sold by
Lennar Homes Of California Inc
Bought by
Chong Jimmy Tze Sheun and Chan Elaine
Purchase Details
Closed on
Nov 11, 2013
Sold by
Chan Edward
Bought by
Chan Elaine
Create a Home Valuation Report for This Property
The Home Valuation Report is an in-depth analysis detailing your home's value as well as a comparison with similar homes in the area
Home Values in the Area
Average Home Value in this Area
Purchase History
| Date | Buyer | Sale Price | Title Company |
|---|---|---|---|
| Chong Tze Sheun | -- | None Available | |
| Chong Jimmy Tze Sheun | $801,000 | North American Title Company | |
| Chan Elaine | -- | North American Title Co Inc |
Source: Public Records
Tax History
| Year | Tax Paid | Tax Assessment Tax Assessment Total Assessment is a certain percentage of the fair market value that is determined by local assessors to be the total taxable value of land and additions on the property. | Land | Improvement |
|---|---|---|---|---|
| 2025 | $15,560 | $981,899 | $672,932 | $308,967 |
| 2024 | $15,560 | $962,647 | $659,738 | $302,909 |
| 2023 | $15,221 | $943,772 | $646,802 | $296,970 |
| 2022 | $14,921 | $925,267 | $634,119 | $291,148 |
| 2021 | $14,627 | $907,125 | $621,685 | $285,440 |
| 2020 | $14,530 | $897,824 | $615,310 | $282,514 |
| 2019 | $14,309 | $880,220 | $603,245 | $276,975 |
| 2018 | $14,027 | $862,961 | $591,416 | $271,545 |
| 2017 | $13,750 | $846,041 | $579,820 | $266,221 |
| 2016 | $13,479 | $829,452 | $568,451 | $261,001 |
| 2015 | $13,254 | $816,993 | $559,912 | $257,081 |
| 2014 | -- | $800,990 | $548,944 | $252,046 |
Source: Public Records
Map
Nearby Homes
Your Personal Tour Guide
Ask me questions while you tour the home.