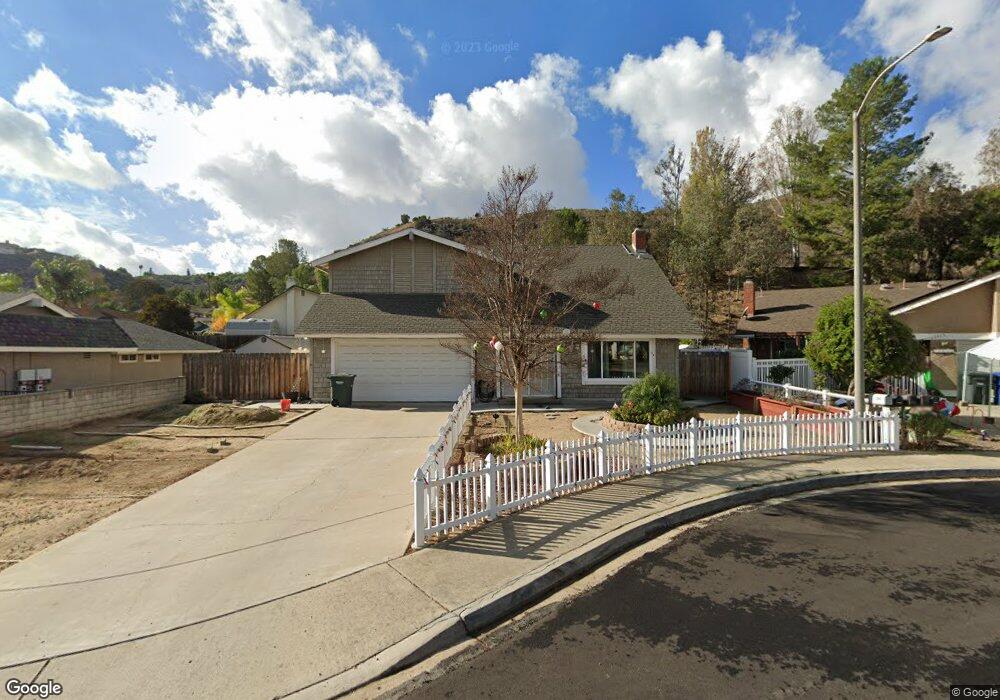
12429 Keemo Terrace Lakeside, CA 92040
Estimated Value: $916,000 - $944,000
4
Beds
3
Baths
2,012
Sq Ft
$462/Sq Ft
Est. Value
About This Home
This home is located at 12429 Keemo Terrace, Lakeside, CA 92040 and is currently estimated at $929,468, approximately $461 per square foot. 12429 Keemo Terrace is a home located in San Diego County with nearby schools including Lakeview Elementary School, Tierra Del Sol Middle School, and El Capitan High School.
Ownership History
Date
Name
Owned For
Owner Type
Purchase Details
Closed on
Dec 3, 2014
Sold by
Harmon Beverly E
Bought by
Wilstermann David J and Wilstermann Loree P
Current Estimated Value
Home Financials for this Owner
Home Financials are based on the most recent Mortgage that was taken out on this home.
Original Mortgage
$417,000
Outstanding Balance
$320,359
Interest Rate
4%
Mortgage Type
New Conventional
Estimated Equity
$609,109
Purchase Details
Closed on
May 11, 2011
Sold by
Harmon Beverly E
Bought by
Harmon Beverly E
Purchase Details
Closed on
Oct 16, 1995
Sold by
Harmon Beverly E
Bought by
Harmon Beverly E
Purchase Details
Closed on
Oct 29, 1993
Sold by
Harmon Beverly E
Bought by
Harmon Beverly E
Home Financials for this Owner
Home Financials are based on the most recent Mortgage that was taken out on this home.
Original Mortgage
$66,000
Interest Rate
6.97%
Create a Home Valuation Report for This Property
The Home Valuation Report is an in-depth analysis detailing your home's value as well as a comparison with similar homes in the area
Home Values in the Area
Average Home Value in this Area
Purchase History
| Date | Buyer | Sale Price | Title Company |
|---|---|---|---|
| Wilstermann David J | $445,000 | Fidelity National Title | |
| Harmon Beverly E | -- | None Available | |
| Harmon Beverly E | -- | -- | |
| Harmon Beverly E | -- | World Title Company |
Source: Public Records
Mortgage History
| Date | Status | Borrower | Loan Amount |
|---|---|---|---|
| Open | Wilstermann David J | $417,000 | |
| Previous Owner | Harmon Beverly E | $66,000 |
Source: Public Records
Tax History Compared to Growth
Tax History
| Year | Tax Paid | Tax Assessment Tax Assessment Total Assessment is a certain percentage of the fair market value that is determined by local assessors to be the total taxable value of land and additions on the property. | Land | Improvement |
|---|---|---|---|---|
| 2025 | $6,993 | $534,810 | $156,494 | $378,316 |
| 2024 | $6,993 | $524,325 | $153,426 | $370,899 |
| 2023 | $6,736 | $514,045 | $150,418 | $363,627 |
| 2022 | $6,611 | $503,967 | $147,469 | $356,498 |
| 2021 | $6,524 | $494,086 | $144,578 | $349,508 |
| 2020 | $6,415 | $489,021 | $143,096 | $345,925 |
| 2019 | $6,296 | $479,434 | $140,291 | $339,143 |
| 2018 | $6,178 | $470,035 | $137,541 | $332,494 |
| 2017 | $820 | $460,820 | $134,845 | $325,975 |
| 2016 | $5,865 | $451,785 | $132,201 | $319,584 |
| 2015 | $5,831 | $445,000 | $130,216 | $314,784 |
| 2014 | $2,196 | $148,507 | $43,456 | $105,051 |
Source: Public Records
Map
Nearby Homes
- 9070 Calle Lucia
- 12431 Ridgeton Dr
- 9055 Calle Lucia
- 12648 Ridgeton Dr
- 12063 Gay Rio Way
- 9100 Single Oak Dr Unit 91
- 9100 Single Oak Dr Unit 41
- 9100 Single Oak Dr Unit 114
- 9100 Single Oak Dr Unit 23
- 13224 Cuyamaca Vista Dr
- 8661 Winter Gardens Blvd Unit 66
- 8661 Winter Gardens Blvd Unit 103
- 8661 Winter Gardens Blvd Unit 78
- 8661 Winter Gardens Blvd Unit 92
- 8661 Winter Gardens Blvd Unit 74
- 8661 Winter Gardens Blvd Unit 7
- 13217 Midnight Star Way
- 13162 Highway 8 Business Unit 19
- 13162 Highway 8 Business Unit 117
- 13162 Highway 8 Business Unit 116
- 12441 Keemo Terrace
- 12415 Keemo Terrace
- 8826 Keemo Ct
- 12401 Keemo Terrace
- 12465 Keemo Terrace
- 8814 Keemo Ct
- 12416 Keemo Terrace
- 12442 Keemo Terrace
- 12430 Keemo Terrace
- 8827 Keemo Ct
- 12454 Keemo Terrace
- 12477 Keemo Terrace
- 8815 Keemo Ct
- 8782 Via Diego Terrace
- 8809 Keemo Ct
- 12489 Keemo Terrace
- 9217 Calle Lucia
- 8812 Via Diego Terrace
- 9223 Calle Lucia
- 8776 Via Diego Terrace