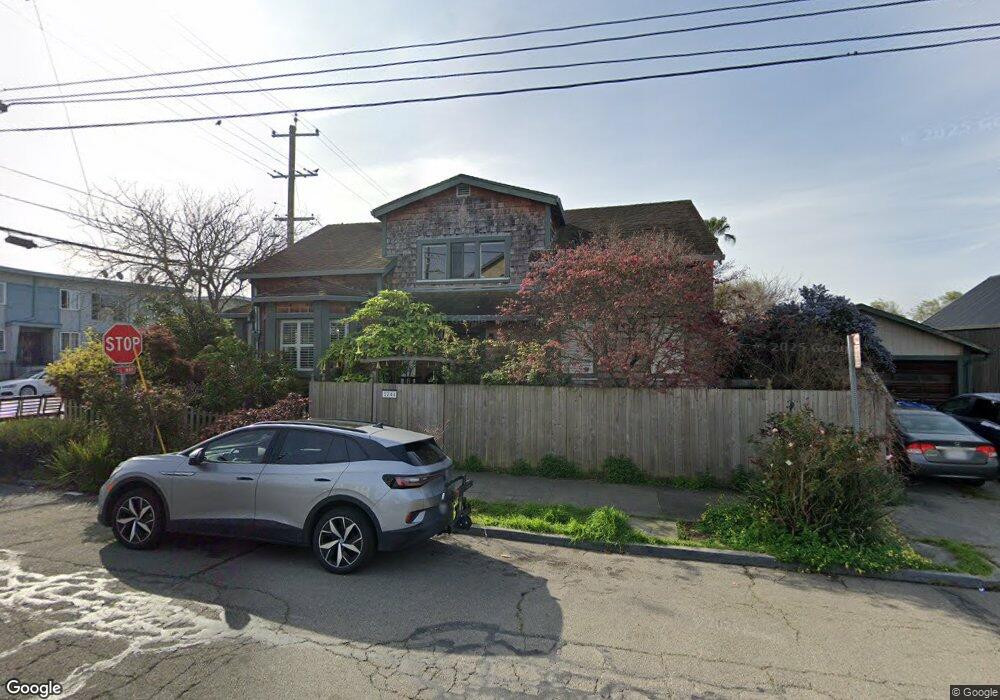
1244 Allston Way Berkeley, CA 94702
West Berkeley NeighborhoodEstimated Value: $1,416,000 - $1,822,000
5
Beds
2
Baths
2,292
Sq Ft
$694/Sq Ft
Est. Value
About This Home
This home is located at 1244 Allston Way, Berkeley, CA 94702 and is currently estimated at $1,591,092, approximately $694 per square foot. 1244 Allston Way is a home located in Alameda County with nearby schools including Rosa Parks Elementary School, Ruth Acty Elementary, and Berkeley Arts Magnet at Whittier School.
Ownership History
Date
Name
Owned For
Owner Type
Purchase Details
Closed on
May 8, 2014
Sold by
Thaman Stephen C
Bought by
Thaman Stephen C and Thaman Raquella Moea
Current Estimated Value
Purchase Details
Closed on
Feb 28, 2012
Sold by
Winter Peggy L and Peggy L Winter Revocable Trust
Bought by
Thaman Stephen C
Home Financials for this Owner
Home Financials are based on the most recent Mortgage that was taken out on this home.
Original Mortgage
$367,376
Outstanding Balance
$252,963
Interest Rate
3.92%
Mortgage Type
New Conventional
Estimated Equity
$1,338,129
Purchase Details
Closed on
Dec 21, 2011
Sold by
Makarova Natalya G
Bought by
Thaman Stephen C
Purchase Details
Closed on
Aug 2, 2005
Sold by
Winter Peggy L
Bought by
Winter Peggy L and Peggy L Winter Revocable Trust
Purchase Details
Closed on
Apr 26, 1999
Sold by
Winter Robert E
Bought by
Winter Peggy L
Home Financials for this Owner
Home Financials are based on the most recent Mortgage that was taken out on this home.
Original Mortgage
$130,000
Interest Rate
6.98%
Create a Home Valuation Report for This Property
The Home Valuation Report is an in-depth analysis detailing your home's value as well as a comparison with similar homes in the area
Home Values in the Area
Average Home Value in this Area
Purchase History
| Date | Buyer | Sale Price | Title Company |
|---|---|---|---|
| Thaman Stephen C | -- | None Available | |
| Thaman Stephen C | $459,500 | Chicago Title Company | |
| Thaman Stephen C | -- | Chicago Title Company | |
| Winter Peggy L | -- | -- | |
| Winter Peggy L | -- | First American Title Guarant |
Source: Public Records
Mortgage History
| Date | Status | Borrower | Loan Amount |
|---|---|---|---|
| Open | Thaman Stephen C | $367,376 | |
| Previous Owner | Winter Peggy L | $130,000 |
Source: Public Records
Tax History
| Year | Tax Paid | Tax Assessment Tax Assessment Total Assessment is a certain percentage of the fair market value that is determined by local assessors to be the total taxable value of land and additions on the property. | Land | Improvement |
|---|---|---|---|---|
| 2025 | $11,051 | $576,750 | $173,025 | $403,725 |
| 2024 | $11,051 | $565,444 | $169,633 | $395,811 |
| 2023 | $10,800 | $554,360 | $166,308 | $388,052 |
| 2022 | $10,553 | $543,490 | $163,047 | $380,443 |
| 2021 | $10,546 | $532,837 | $159,851 | $372,986 |
| 2020 | $9,833 | $527,377 | $158,213 | $369,164 |
| 2019 | $9,290 | $517,040 | $155,112 | $361,928 |
| 2018 | $9,104 | $506,905 | $152,071 | $354,834 |
| 2017 | $8,775 | $496,968 | $149,090 | $347,878 |
| 2016 | $8,392 | $487,224 | $146,167 | $341,057 |
| 2015 | $8,266 | $479,908 | $143,972 | $335,936 |
| 2014 | $8,169 | $470,510 | $141,153 | $329,357 |
Source: Public Records
Map
Nearby Homes
- 2144 Curtis St
- 2231 Byron St
- 2324 Browning St
- 1919 Curtis St
- 1261 Hearst Ave
- 2327 10th St Unit 4
- 2241 Ninth St
- 1039 Channing Way
- 2013 9th St
- 1411 Hearst Ave Unit 2
- 1128 Delaware St
- 1578 Allston Way
- 2118 California St
- 1142 Dwight Way
- 931 Bancroft Way
- 1728 Curtis St
- 1118 Dwight Way
- 1813 Sacramento St
- 1092 Dwight Way
- 1322 Virginia St
- 2204 Bonar St
- 1236 Allston Way
- 2206 Bonar St
- 1234 Allston Way
- 1239 Allston Way
- 2210 Bonar St
- 1245 Allston Way
- 1243 Allston Way
- 2146 Bonar St
- 1230 Allston Way
- 1237 Allston Way
- 1231 Allston Way
- 2209 Browning St
- 2214 Bonar St
- 2203 Browning St
- 2211 Browning St
- 1229 Allston Way
- 2138 Bonar St
- 2216 Bonar St
- 1225 Allston Way
Your Personal Tour Guide
Ask me questions while you tour the home.