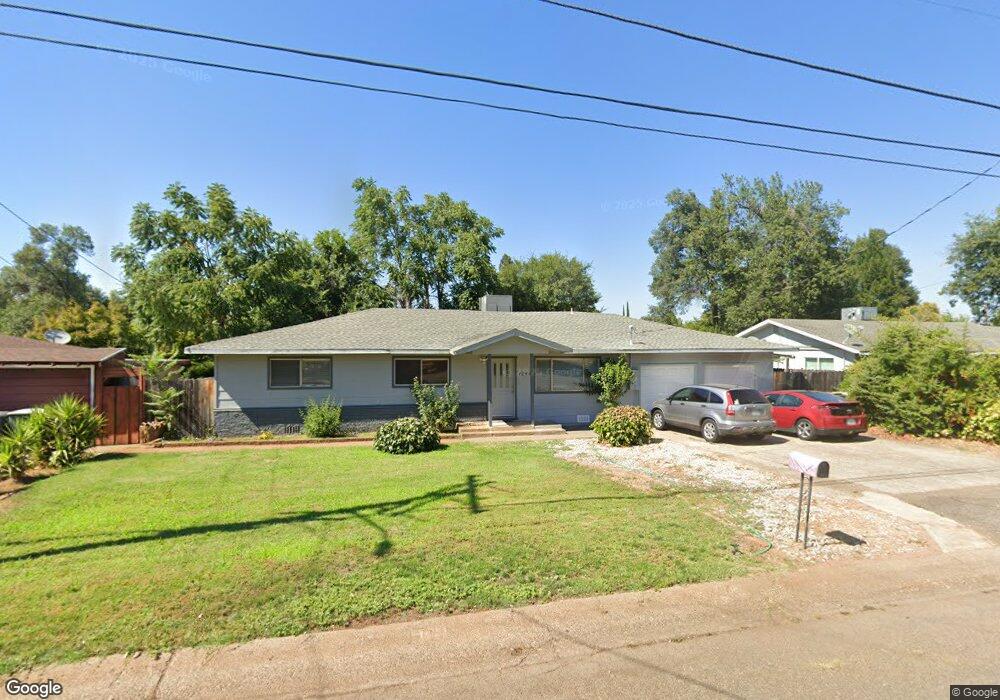
1244 de Moll Dr Redding, CA 96002
Enterprise NeighborhoodEstimated Value: $274,000 - $321,000
3
Beds
2
Baths
1,320
Sq Ft
$224/Sq Ft
Est. Value
About This Home
This home is located at 1244 de Moll Dr, Redding, CA 96002 and is currently estimated at $296,208, approximately $224 per square foot. 1244 de Moll Dr is a home located in Shasta County with nearby schools including Lassen View Elementary School, Parsons Junior High School, and Enterprise High School.
Ownership History
Date
Name
Owned For
Owner Type
Purchase Details
Closed on
Mar 10, 2011
Sold by
Corley Starlyn Kay
Bought by
Corley Starlyn Kay
Current Estimated Value
Home Financials for this Owner
Home Financials are based on the most recent Mortgage that was taken out on this home.
Original Mortgage
$105,000
Outstanding Balance
$72,077
Interest Rate
4.77%
Mortgage Type
New Conventional
Estimated Equity
$224,131
Purchase Details
Closed on
Jun 26, 2009
Sold by
Daniels John Wayne and Daniels John W
Bought by
Corley Starlyn Kay
Purchase Details
Closed on
Nov 15, 2000
Sold by
Bert F & Beverly D Corford Family Living Trus
Bought by
Corley Starlyn Kay
Home Financials for this Owner
Home Financials are based on the most recent Mortgage that was taken out on this home.
Original Mortgage
$80,000
Interest Rate
7.82%
Mortgage Type
Seller Take Back
Purchase Details
Closed on
Aug 18, 1998
Sold by
Corford Bert F and Corley Bert F
Bought by
Corford Bert Foyle and Corford Beverly Darlene
Create a Home Valuation Report for This Property
The Home Valuation Report is an in-depth analysis detailing your home's value as well as a comparison with similar homes in the area
Home Values in the Area
Average Home Value in this Area
Purchase History
| Date | Buyer | Sale Price | Title Company |
|---|---|---|---|
| Corley Starlyn Kay | -- | Fidelity National Title | |
| Corley Starlyn Kay | -- | None Available | |
| Corley Starlyn Kay | $80,000 | First American Title Co | |
| Corford Bert Foyle | -- | -- |
Source: Public Records
Mortgage History
| Date | Status | Borrower | Loan Amount |
|---|---|---|---|
| Open | Corley Starlyn Kay | $105,000 | |
| Closed | Corley Starlyn Kay | $80,000 | |
| Closed | Corley Starlyn Kay | $20,000 |
Source: Public Records
Tax History
| Year | Tax Paid | Tax Assessment Tax Assessment Total Assessment is a certain percentage of the fair market value that is determined by local assessors to be the total taxable value of land and additions on the property. | Land | Improvement |
|---|---|---|---|---|
| 2025 | $807 | $71,401 | $13,378 | $58,023 |
| 2024 | $795 | $70,002 | $13,116 | $56,886 |
| 2023 | $795 | $68,630 | $12,859 | $55,771 |
| 2022 | $773 | $67,285 | $12,607 | $54,678 |
| 2021 | $746 | $65,966 | $12,360 | $53,606 |
| 2020 | $742 | $65,291 | $12,234 | $53,057 |
| 2019 | $736 | $64,012 | $11,995 | $52,017 |
| 2018 | $728 | $62,758 | $11,760 | $50,998 |
| 2017 | $739 | $61,529 | $11,530 | $49,999 |
| 2016 | $693 | $60,323 | $11,304 | $49,019 |
| 2015 | $687 | $59,418 | $11,135 | $48,283 |
| 2014 | $682 | $58,255 | $10,917 | $47,338 |
Source: Public Records
Map
Nearby Homes
- 3703 Harrow Ct
- 1354 Harpole Rd
- 1513 Harpole Rd
- 4302 Paulson Ln
- 4323 Churn Crk Rd
- 3527 Adams Ln
- 952 Camino Ct
- 737 Estate St
- 751 Woodacre Dr
- 688 Julie Way
- 723 Woodacre Dr
- 3293 Middleton Ln
- 1091 Del Sol Place
- 3428 Adams Ln
- 1289 Arizona St
- 3708 Traverse St
- 3528 Silverwood St
- 3466 Silverwood St
- 1209 C St
- 3283 Middleton Ln
- 1240 de Moll Dr
- 3910 Roesner Ave
- 1248 de Moll Dr
- 1236 de Moll Dr
- 3792 Harrow Ct
- 3924 Roesner Ave
- 3787 Harrow Ct
- 1237 de Moll Dr
- 1222 de Moll Dr
- 3780 Harrow Ct
- 1223 de Moll Dr
- 3938 Roesner Ave
- 3775 Harrow Ct
- 1210 de Moll Dr
- 3886 Alma Ave
- 1213 de Moll Dr
- 3931 Roesner Ave
- 3768 Harrow Ct
- 3914 Alma Ave
- 3872 Alma Ave
Your Personal Tour Guide
Ask me questions while you tour the home.