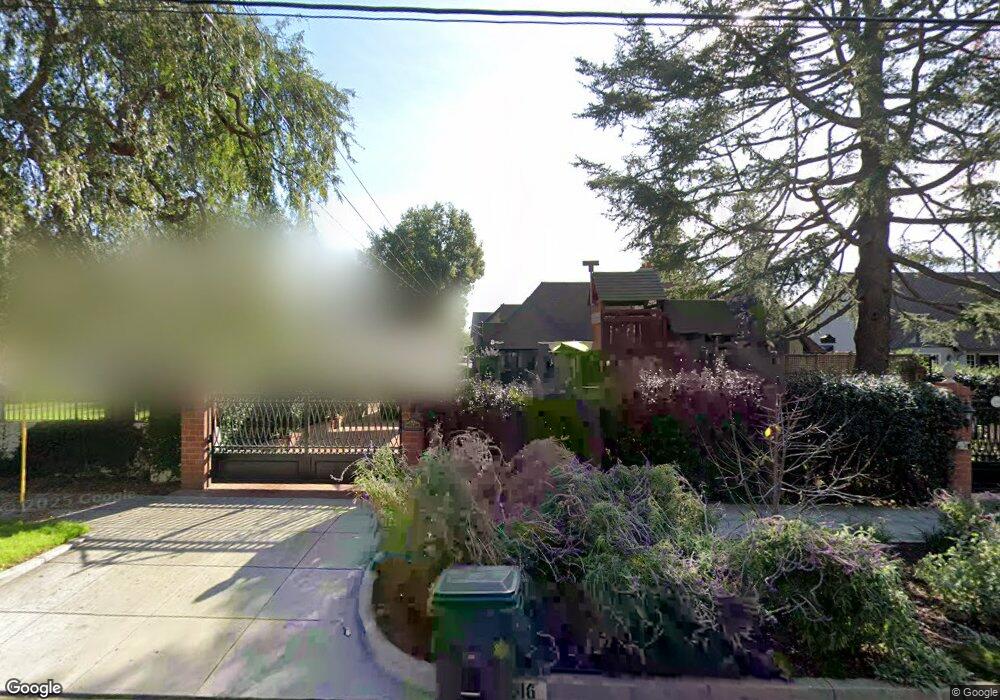
1246 E Calaveras St Altadena, CA 91001
Estimated Value: $940,000 - $1,833,751
4
Beds
3
Baths
2,931
Sq Ft
$478/Sq Ft
Est. Value
About This Home
This home is located at 1246 E Calaveras St, Altadena, CA 91001 and is currently estimated at $1,399,917, approximately $477 per square foot. 1246 E Calaveras St is a home located in Los Angeles County with nearby schools including Altadena Arts Magnet Elementary, Charles W. Eliot Arts Magnet Academy, and Pasadena High School.
Ownership History
Date
Name
Owned For
Owner Type
Purchase Details
Closed on
Mar 11, 2017
Sold by
Calkins John and Calkins Guadalupe
Bought by
Calkins John and Calkins Guadalupe
Current Estimated Value
Purchase Details
Closed on
Oct 28, 2001
Sold by
Cornell Brad
Bought by
Calkins John L and Calkins Guadalupe
Home Financials for this Owner
Home Financials are based on the most recent Mortgage that was taken out on this home.
Original Mortgage
$564,000
Outstanding Balance
$220,601
Interest Rate
6.73%
Estimated Equity
$1,179,316
Purchase Details
Closed on
May 16, 2000
Sold by
Trust Marlow Marilyn Tr Hortense M Reece
Bought by
Cornell Brad
Purchase Details
Closed on
Mar 18, 1998
Sold by
Reece Hortense M
Bought by
Marlow Marilyn and Declaration Of Trust Of Horten
Create a Home Valuation Report for This Property
The Home Valuation Report is an in-depth analysis detailing your home's value as well as a comparison with similar homes in the area
Home Values in the Area
Average Home Value in this Area
Purchase History
| Date | Buyer | Sale Price | Title Company |
|---|---|---|---|
| Calkins John | -- | None Available | |
| Calkins John | -- | None Available | |
| Calkins John L | $705,000 | Southland Title Corporation | |
| Cornell Brad | $450,000 | Southland Title Corporation | |
| Marlow Marilyn | -- | -- |
Source: Public Records
Mortgage History
| Date | Status | Borrower | Loan Amount |
|---|---|---|---|
| Open | Calkins John L | $564,000 |
Source: Public Records
Tax History
| Year | Tax Paid | Tax Assessment Tax Assessment Total Assessment is a certain percentage of the fair market value that is determined by local assessors to be the total taxable value of land and additions on the property. | Land | Improvement |
|---|---|---|---|---|
| 2025 | $12,757 | $1,109,610 | $672,165 | $437,445 |
| 2024 | $12,757 | $1,087,854 | $658,986 | $428,868 |
| 2023 | $12,648 | $1,066,524 | $646,065 | $420,459 |
| 2022 | $12,213 | $1,045,613 | $633,398 | $412,215 |
| 2021 | $11,587 | $1,025,112 | $620,979 | $404,133 |
| 2019 | $11,152 | $994,709 | $602,561 | $392,148 |
| 2018 | $11,293 | $975,206 | $590,747 | $384,459 |
| 2016 | $10,942 | $937,339 | $567,808 | $369,531 |
| 2015 | $10,824 | $923,260 | $559,279 | $363,981 |
| 2014 | $10,598 | $905,176 | $548,324 | $356,852 |
Source: Public Records
Map
Nearby Homes
- 1299 Boston St
- 2186 Mar Vista Ave
- 1351 Sonoma Dr
- 1200 Morada Place
- 1275 New York Dr
- 2469 Holliston Ave
- 287 287 E Calaveras St
- 1920 Maiden Ln
- 1000 Morada Place
- 2546 Highland Ave
- 916 Marcheta St
- 2574 Ganesha Ave
- 2261 Sinaloa Ave
- 2560 Maiden Ln
- 1295 E Woodbury Rd
- 912 E Altadena Dr
- 1578 Morada Place
- 801 E Mendocino St Unit 3B
- 1290 E Woodbury Rd
- 1688 E Mendocino St
- 1234 E Calaveras St
- 1260 E Calaveras St
- 1222 E Calaveras St
- 1272 E Calaveras St
- 1241 Meadowbrook Rd
- 1251 Meadowbrook Rd
- 1231 Meadowbrook Rd
- 1261 Meadowbrook Rd
- 1233 E Calaveras St
- 1212 E Calaveras St
- 1286 E Calaveras St
- 1227 Meadowbrook Rd
- 1249 E Calaveras St
- 1273 Meadowbrook Rd
- 1263 E Calaveras St
- 1215 Meadowbrook Rd
- 1281 Meadowbrook Rd
- 1223 E Calaveras St
- 1237 E Calaveras St
- 1296 E Calaveras St
Your Personal Tour Guide
Ask me questions while you tour the home.