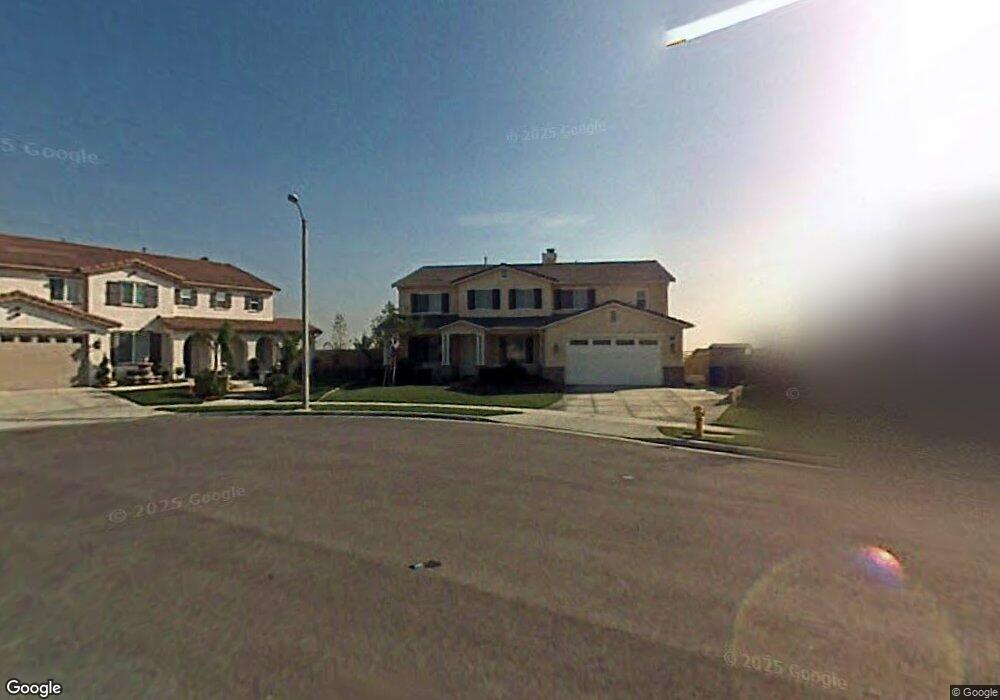
12467 Green Tree Dr Rancho Cucamonga, CA 91739
Etiwanda NeighborhoodEstimated Value: $1,212,481 - $1,420,000
6
Beds
4
Baths
3,650
Sq Ft
$365/Sq Ft
Est. Value
About This Home
This home is located at 12467 Green Tree Dr, Rancho Cucamonga, CA 91739 and is currently estimated at $1,331,120, approximately $364 per square foot. 12467 Green Tree Dr is a home located in San Bernardino County with nearby schools including John L. Golden Elementary, Day Creek Intermediate, and Los Osos High.
Ownership History
Date
Name
Owned For
Owner Type
Purchase Details
Closed on
Jul 24, 2025
Sold by
Hockwald Christopher and Rochelle Cynthia
Bought by
Christopher Allen Hockwald and Rochelle Cynthia
Current Estimated Value
Purchase Details
Closed on
Feb 26, 2014
Sold by
Hockwald Christopher
Bought by
Hockwald Christopher and Hockwald Rochelle Cynthia
Purchase Details
Closed on
Jun 20, 2003
Sold by
Hockwald Rochelle Cynthia
Bought by
Hockwald Christopher
Home Financials for this Owner
Home Financials are based on the most recent Mortgage that was taken out on this home.
Original Mortgage
$52,322
Interest Rate
5.26%
Mortgage Type
Credit Line Revolving
Purchase Details
Closed on
Jun 6, 2003
Sold by
Standard Pacific Corp
Bought by
Hogkwald Christopher
Home Financials for this Owner
Home Financials are based on the most recent Mortgage that was taken out on this home.
Original Mortgage
$52,322
Interest Rate
5.26%
Mortgage Type
Credit Line Revolving
Create a Home Valuation Report for This Property
The Home Valuation Report is an in-depth analysis detailing your home's value as well as a comparison with similar homes in the area
Home Values in the Area
Average Home Value in this Area
Purchase History
| Date | Buyer | Sale Price | Title Company |
|---|---|---|---|
| Christopher Allen Hockwald | -- | None Listed On Document | |
| Hockwald Christopher | -- | None Available | |
| Hockwald Christopher | -- | Fidelity | |
| Hogkwald Christopher | $523,500 | Fidelity |
Source: Public Records
Mortgage History
| Date | Status | Borrower | Loan Amount |
|---|---|---|---|
| Previous Owner | Hockwald Christopher | $52,322 | |
| Previous Owner | Hogkwald Christopher | $418,577 |
Source: Public Records
Tax History Compared to Growth
Tax History
| Year | Tax Paid | Tax Assessment Tax Assessment Total Assessment is a certain percentage of the fair market value that is determined by local assessors to be the total taxable value of land and additions on the property. | Land | Improvement |
|---|---|---|---|---|
| 2025 | $11,743 | $787,067 | $189,454 | $597,613 |
| 2024 | $11,743 | $771,634 | $185,739 | $585,895 |
| 2023 | $11,466 | $756,504 | $182,097 | $574,407 |
| 2022 | $11,297 | $741,670 | $178,526 | $563,144 |
| 2021 | $11,106 | $727,127 | $175,025 | $552,102 |
| 2020 | $10,951 | $719,671 | $173,230 | $546,441 |
| 2019 | $10,680 | $705,559 | $169,833 | $535,726 |
| 2018 | $10,931 | $691,725 | $166,503 | $525,222 |
| 2017 | $11,102 | $678,162 | $163,238 | $514,924 |
| 2016 | $10,854 | $664,864 | $160,037 | $504,827 |
| 2015 | $10,768 | $654,877 | $157,633 | $497,244 |
| 2014 | $10,446 | $642,049 | $154,545 | $487,504 |
Source: Public Records
Map
Nearby Homes
- 12406 Challendon Dr
- 12430 Split Rein Dr
- 12184 Clydesdale Dr
- 12487 Altura Dr
- 5675 W Overlook Dr
- 6197 Greenwood Place
- 12794 Windstar Dr
- 12877 Golden Prairie Dr
- 6331 Thunder Mountain Ave
- 12420 Silk Oak Ct
- 12427 Silk Oak Ct
- 13123 Carriage Trail Ct
- 12331 Dove Tree Dr
- 5450 Stagecoach Ct
- 6264 Shore Pine Ct
- 5231 Flora Ct
- 12619 Dupont Dr
- 6525 Etiwanda Ave
- 12356 Thistle Dr
- 5212 Crimson Place
- 12459 Green Tree Dr
- 12473 Green Tree Dr
- 12472 Dapple Dr
- 12454 Dapple Dr
- 12445 Green Tree Dr
- 12472 Green Tree Dr
- 12446 Dapple Dr
- 12464 Green Tree Dr
- 12476 Dapple Dr
- 12456 Green Tree Dr
- 12439 Green Tree Dr
- 12442 Green Tree Dr
- 12432 Dapple Dr
- 12467 Dapple Dr
- 12475 Dapple Dr
- 12475 Challendon Dr
- 12459 Dapple Dr
- 12459 Challendon Dr
- 12423 Green Tree Dr
- 12436 Green Tree Dr