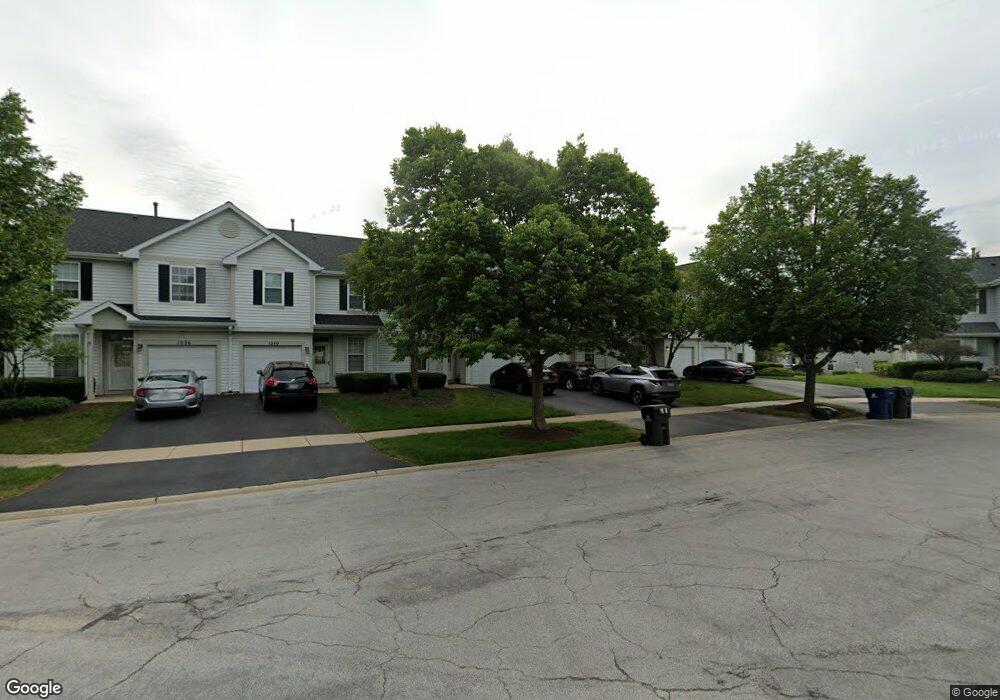
1248 Arapahoe Ct Unit 61 Naperville, IL 60540
West Wind NeighborhoodEstimated Value: $316,000 - $335,321
3
Beds
3
Baths
1,499
Sq Ft
$218/Sq Ft
Est. Value
About This Home
This home is located at 1248 Arapahoe Ct Unit 61, Naperville, IL 60540 and is currently estimated at $327,330, approximately $218 per square foot. 1248 Arapahoe Ct Unit 61 is a home located in DuPage County with nearby schools including May Watts Elementary School, Thayer J. Hill Middle School, and Metea Valley High School.
Ownership History
Date
Name
Owned For
Owner Type
Purchase Details
Closed on
Apr 4, 2024
Sold by
Majus Alvydas and Majus Onute Anna
Bought by
Majus Alvydas and Majus Onute Anna
Current Estimated Value
Purchase Details
Closed on
Apr 5, 2002
Sold by
Chlopek Richard
Bought by
Masiene Ona and Majus Alvydas
Home Financials for this Owner
Home Financials are based on the most recent Mortgage that was taken out on this home.
Original Mortgage
$152,605
Interest Rate
6.82%
Mortgage Type
FHA
Purchase Details
Closed on
Nov 15, 1994
Sold by
Estes Park Ltd Partnership
Bought by
Chlopek Richard
Home Financials for this Owner
Home Financials are based on the most recent Mortgage that was taken out on this home.
Original Mortgage
$92,400
Interest Rate
8.87%
Create a Home Valuation Report for This Property
The Home Valuation Report is an in-depth analysis detailing your home's value as well as a comparison with similar homes in the area
Home Values in the Area
Average Home Value in this Area
Purchase History
| Date | Buyer | Sale Price | Title Company |
|---|---|---|---|
| Majus Alvydas | -- | None Listed On Document | |
| Masiene Ona | $155,000 | -- | |
| Chlopek Richard | $128,500 | -- |
Source: Public Records
Mortgage History
| Date | Status | Borrower | Loan Amount |
|---|---|---|---|
| Previous Owner | Masiene Ona | $152,605 | |
| Previous Owner | Chlopek Richard | $92,400 |
Source: Public Records
Tax History Compared to Growth
Tax History
| Year | Tax Paid | Tax Assessment Tax Assessment Total Assessment is a certain percentage of the fair market value that is determined by local assessors to be the total taxable value of land and additions on the property. | Land | Improvement |
|---|---|---|---|---|
| 2024 | $4,482 | $87,808 | $23,794 | $64,014 |
| 2023 | $4,741 | $78,900 | $21,380 | $57,520 |
| 2022 | $4,482 | $71,580 | $19,250 | $52,330 |
| 2021 | $4,332 | $69,020 | $18,560 | $50,460 |
| 2020 | $4,326 | $69,020 | $18,560 | $50,460 |
| 2019 | $4,144 | $65,640 | $17,650 | $47,990 |
| 2018 | $3,902 | $61,120 | $16,590 | $44,530 |
| 2017 | $3,786 | $59,050 | $16,030 | $43,020 |
| 2016 | $3,707 | $56,670 | $15,380 | $41,290 |
| 2015 | $3,658 | $53,800 | $14,600 | $39,200 |
| 2014 | $3,612 | $51,570 | $13,880 | $37,690 |
| 2013 | $3,606 | $51,930 | $13,980 | $37,950 |
Source: Public Records
Map
Nearby Homes
- 891 Lowell Ln
- 1262 Rhodes Ln Unit 2701
- 2459 Emerson Ln
- 1208 Tennyson Ln
- 2809 Blakely Ln Unit 24
- 1114 Tennyson Ln
- 822 Shandrew Dr Unit 103
- 2783 Blakely Ln Unit 34
- 1259 Natchez Trace Cir
- 856 Cardiff Rd
- 7S410 Arbor Dr
- 1033 Emerald Dr
- 316 Hemlock Ln
- 134 S Whispering Hills Dr
- 27W264 80th St
- 4328 Chelsea Manor Cir
- 225 Elmwood Dr
- 4177 Irving Rd
- 122 Encina Dr
- 845 Tulip Ln
- 1252 Arapahoe Ct
- 1244 Arapahoe Ct Unit 60
- 1256 Arapahoe Ct Unit 63
- 1240 Arapahoe Ct Unit 59
- 1256 Arapaho Ct
- 1236 Arapahoe Ct Unit 58
- 1260 Arapahoe Ct
- 1260 Arapaho Ct
- 1224 Arapahoe Ct Unit 57
- 1264 Arapahoe Ct Unit 65
- 1268 Arapahoe Ct
- 1220 Arapahoe Ct
- 1223 Denver Ct
- 1223 Denver Ct Unit 1223
- 1219 Denver Ct
- 1227 Denver Ct Unit 41
- 1215 Denver Ct Unit 44
- 1211 Denver Ct
- 1268 Arapaho Ct
- 1216 Arapaho Ct