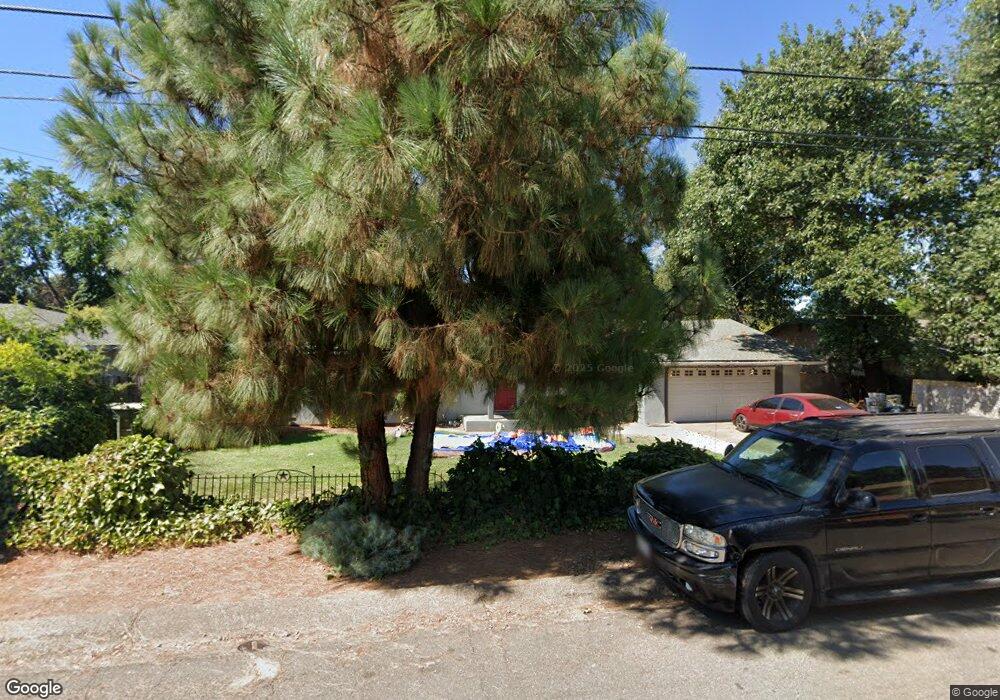
1248 de Moll Dr Redding, CA 96002
Enterprise NeighborhoodEstimated Value: $278,000 - $355,000
3
Beds
2
Baths
1,606
Sq Ft
$203/Sq Ft
Est. Value
About This Home
This home is located at 1248 de Moll Dr, Redding, CA 96002 and is currently estimated at $325,747, approximately $202 per square foot. 1248 de Moll Dr is a home located in Shasta County with nearby schools including Lassen View Elementary School, Parsons Junior High School, and Enterprise High School.
Ownership History
Date
Name
Owned For
Owner Type
Purchase Details
Closed on
Jul 15, 2015
Sold by
Hovis Tamra R
Bought by
Hovis David and Hovis Tamra
Current Estimated Value
Home Financials for this Owner
Home Financials are based on the most recent Mortgage that was taken out on this home.
Original Mortgage
$125,000
Outstanding Balance
$97,434
Interest Rate
3.85%
Mortgage Type
New Conventional
Estimated Equity
$228,313
Purchase Details
Closed on
Dec 30, 2004
Sold by
Andree Robert George
Bought by
Hovis Tamra R
Create a Home Valuation Report for This Property
The Home Valuation Report is an in-depth analysis detailing your home's value as well as a comparison with similar homes in the area
Home Values in the Area
Average Home Value in this Area
Purchase History
| Date | Buyer | Sale Price | Title Company |
|---|---|---|---|
| Hovis David | -- | Placer Title Company | |
| Hovis Tamra R | -- | -- |
Source: Public Records
Mortgage History
| Date | Status | Borrower | Loan Amount |
|---|---|---|---|
| Open | Hovis David | $125,000 |
Source: Public Records
Tax History
| Year | Tax Paid | Tax Assessment Tax Assessment Total Assessment is a certain percentage of the fair market value that is determined by local assessors to be the total taxable value of land and additions on the property. | Land | Improvement |
|---|---|---|---|---|
| 2025 | $872 | $77,475 | $13,378 | $64,097 |
| 2024 | $859 | $75,957 | $13,116 | $62,841 |
| 2023 | $859 | $74,468 | $12,859 | $61,609 |
| 2022 | $835 | $73,008 | $12,607 | $60,401 |
| 2021 | $806 | $71,577 | $12,360 | $59,217 |
| 2020 | $803 | $70,844 | $12,234 | $58,610 |
| 2019 | $796 | $69,456 | $11,995 | $57,461 |
| 2018 | $786 | $68,095 | $11,760 | $56,335 |
| 2017 | $799 | $66,761 | $11,530 | $55,231 |
| 2016 | $749 | $65,453 | $11,304 | $54,149 |
| 2015 | $743 | $64,471 | $11,135 | $53,336 |
| 2014 | -- | $63,209 | $10,917 | $52,292 |
Source: Public Records
Map
Nearby Homes
- 3703 Harrow Ct
- 1513 Harpole Rd
- 4302 Paulson Ln
- 4323 Churn Crk Rd
- 952 Camino Ct
- 3527 Adams Ln
- 3293 Middleton Ln
- 688 Julie Way
- 1091 Del Sol Place
- 723 Woodacre Dr
- 3466 Silverwood St
- 3428 Adams Ln
- 3283 Middleton Ln
- 3425 Silverwood St
- 3708 Traverse St
- 3178 Lawrence Rd
- 1075 Le Brun Ln
- 1209 C St
- 1106 2nd St
- 2068 Solar Way
- 1244 de Moll Dr
- 1240 de Moll Dr
- 3787 Harrow Ct
- 3886 Alma Ave
- 3910 Roesner Ave
- 3792 Harrow Ct
- 3914 Alma Ave
- 3775 Harrow Ct
- 3872 Alma Ave
- 3924 Roesner Ave
- 1236 de Moll Dr
- 3931 Roesner Ave
- 3780 Harrow Ct
- 3856 Alma Ave
- 1237 de Moll Dr
- 3895 Alma Ave
- 3883 Alma Ave
- 3936 Alma Ave
- 3938 Roesner Ave
- 3763 Harrow Ct
Your Personal Tour Guide
Ask me questions while you tour the home.