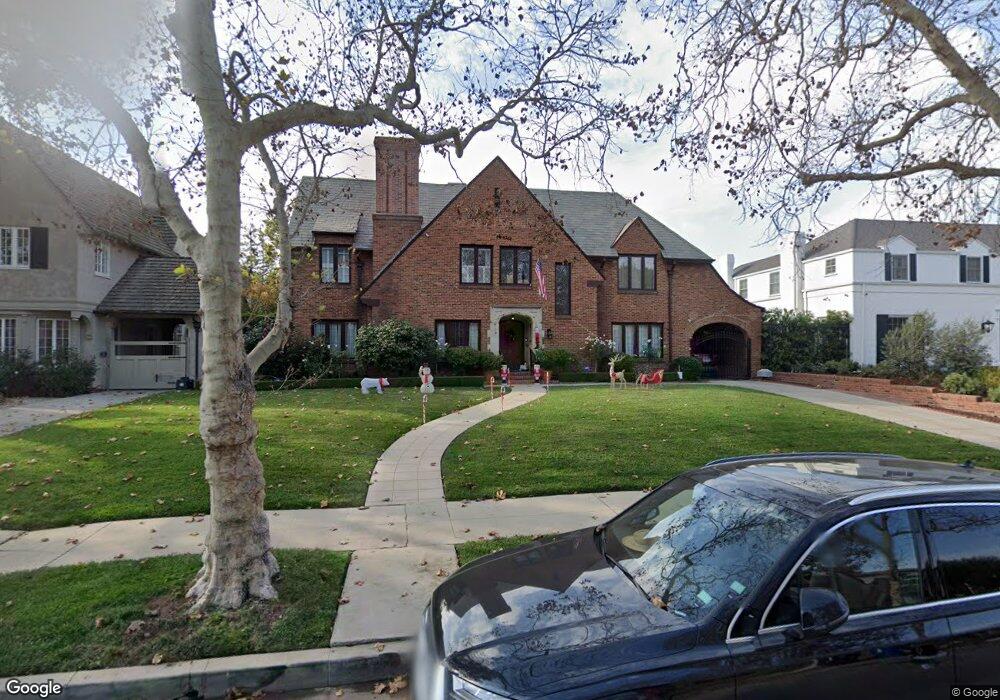
125 S Las Palmas Ave Los Angeles, CA 90004
Hancock Park NeighborhoodEstimated Value: $2,990,000 - $4,971,000
5
Beds
4
Baths
4,494
Sq Ft
$957/Sq Ft
Est. Value
About This Home
This home is located at 125 S Las Palmas Ave, Los Angeles, CA 90004 and is currently estimated at $4,302,041, approximately $957 per square foot. 125 S Las Palmas Ave is a home located in Los Angeles County with nearby schools including Third Street Elementary School, John Burroughs Middle School, and Fairfax High School.
Ownership History
Date
Name
Owned For
Owner Type
Purchase Details
Closed on
Aug 22, 2024
Sold by
Campbell Alexander N and Minor Judith
Bought by
Alexander N Campbell Jr And Judith Minor Camp and Campbell
Current Estimated Value
Purchase Details
Closed on
Feb 1, 2012
Sold by
Campbell John B T and The John Bayard Taylor Campbel
Bought by
Campbell Alexander N
Purchase Details
Closed on
Jan 27, 2012
Sold by
Campbell Alexander N
Bought by
Campbell Alexander N and The Alexander N Campbell Jr Re
Purchase Details
Closed on
Sep 10, 2009
Sold by
Campbell Maurine Mcnee and Campbell Alexander N
Bought by
Campbell Alexander N and The Maurine Mcnee Campbell Fam
Purchase Details
Closed on
Jan 12, 2007
Sold by
Campbell Maurine Mcnee and Campbell Alexander N
Bought by
Campbell Alexander N and Campbell John B T
Purchase Details
Closed on
May 16, 2000
Sold by
Campbell Alex N
Bought by
Campbell Alexander N and Campbell Maurine Mcnee
Create a Home Valuation Report for This Property
The Home Valuation Report is an in-depth analysis detailing your home's value as well as a comparison with similar homes in the area
Home Values in the Area
Average Home Value in this Area
Purchase History
| Date | Buyer | Sale Price | Title Company |
|---|---|---|---|
| Alexander N Campbell Jr And Judith Minor Camp | -- | None Listed On Document | |
| Campbell Alexander N | $500,000 | None Available | |
| Campbell Alexander N | $500,000 | None Available | |
| Campbell Alexander N | -- | None Available | |
| Campbell Alexander N | -- | None Available | |
| Campbell Alexander N | -- | None Available | |
| Campbell Alexander N | $924,500 | None Available | |
| Campbell Alexander N | -- | None Available | |
| Campbell Alexander N | -- | None Available | |
| Campbell Alexander N | -- | -- |
Source: Public Records
Tax History Compared to Growth
Tax History
| Year | Tax Paid | Tax Assessment Tax Assessment Total Assessment is a certain percentage of the fair market value that is determined by local assessors to be the total taxable value of land and additions on the property. | Land | Improvement |
|---|---|---|---|---|
| 2025 | $19,629 | $1,598,867 | $1,012,010 | $586,857 |
| 2024 | $19,629 | $1,567,517 | $992,167 | $575,350 |
| 2023 | $19,259 | $1,536,782 | $972,713 | $564,069 |
| 2022 | $18,383 | $1,506,650 | $953,641 | $553,009 |
| 2021 | $18,145 | $1,477,109 | $934,943 | $542,166 |
| 2019 | $17,612 | $1,433,299 | $907,213 | $526,086 |
| 2018 | $17,425 | $1,405,196 | $889,425 | $515,771 |
| 2016 | $16,649 | $1,350,633 | $854,889 | $495,744 |
| 2015 | $16,409 | $1,330,346 | $842,048 | $488,298 |
| 2014 | $16,464 | $1,304,287 | $825,554 | $478,733 |
Source: Public Records
Map
Nearby Homes
- 172 S Mccadden Place
- 157 N Las Palmas Ave
- 143 S Highland Ave
- 191 S Hudson Ave
- 228 S Hudson Ave
- 138 S Hudson Place
- 322 N June St
- 248 S Hudson Ave
- 120 N Orange Dr
- 109 N Sycamore Ave Unit 102
- 143 N Sycamore Ave
- 211 S Muirfield Rd
- 143 S Muirfield Rd
- 348 S Orange Dr
- 434 N Mansfield Ave
- 420 N Orange Dr
- 183 S Detroit St
- 358 S Sycamore Ave
- 147 N Detroit St
- 203 S Detroit St Unit 201
- 133 S Las Palmas Ave
- 117 S Las Palmas Ave
- 109 S Las Palmas Ave
- 141 S Las Palmas Ave
- 122 S Mccadden Place
- 130 S Mccadden Place
- 116 S Mccadden Place
- 136 S Mccadden Place
- 108 S Mccadden Place
- 101 S Las Palmas Ave
- 124 S Las Palmas Ave
- 149 S Las Palmas Ave
- 132 S Las Palmas Ave
- 144 S Mccadden Place
- 116 S Las Palmas Ave
- 140 S Las Palmas Ave
- 100 S Mccadden Place
- 108 S Las Palmas Ave
- 150 S Mccadden Place
- 157 S Las Palmas Ave