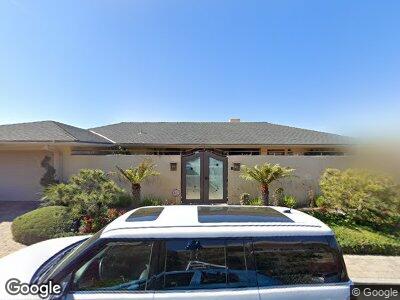
1250 Anacapa Way Laguna Beach, CA 92651
Mystic Hills NeighborhoodEstimated Value: $3,239,000 - $4,424,000
3
Beds
4
Baths
3,020
Sq Ft
$1,262/Sq Ft
Est. Value
About This Home
This home is located at 1250 Anacapa Way, Laguna Beach, CA 92651 and is currently estimated at $3,811,891, approximately $1,262 per square foot. 1250 Anacapa Way is a home located in Orange County with nearby schools including El Morro Elementary School, Thurston Middle School, and Laguna Beach High School.
Ownership History
Date
Name
Owned For
Owner Type
Purchase Details
Closed on
Aug 2, 2004
Sold by
Johnson Kenny and Johnson Julia Lougee Damato
Bought by
Johnson Kenny and Johnson Julia Lougee Damato
Current Estimated Value
Home Financials for this Owner
Home Financials are based on the most recent Mortgage that was taken out on this home.
Original Mortgage
$1,500,000
Interest Rate
5.25%
Mortgage Type
Purchase Money Mortgage
Purchase Details
Closed on
Apr 2, 2001
Sold by
Johnson Kenny and Johnson Julia Lougee Damato
Bought by
Johnson Kenny and Johnson Julia Lougee Damato
Home Financials for this Owner
Home Financials are based on the most recent Mortgage that was taken out on this home.
Original Mortgage
$850,000
Interest Rate
7.09%
Mortgage Type
Unknown
Create a Home Valuation Report for This Property
The Home Valuation Report is an in-depth analysis detailing your home's value as well as a comparison with similar homes in the area
Home Values in the Area
Average Home Value in this Area
Purchase History
| Date | Buyer | Sale Price | Title Company |
|---|---|---|---|
| Johnson Kenny | -- | -- | |
| Johnson Kenny | -- | Lawyers Title | |
| Johnson Kenny | -- | -- | |
| Johnson Kenny | -- | -- |
Source: Public Records
Mortgage History
| Date | Status | Borrower | Loan Amount |
|---|---|---|---|
| Closed | Kenny And Julia Johnson Family | $2,383,000 | |
| Closed | Johnson Kenny | $1,450,000 | |
| Closed | Johnson Kenny | $0 | |
| Closed | Johnson Kenny | $1,500,000 | |
| Closed | Johnson Kenny | $500,000 | |
| Closed | Johnson Kenneth A | $850,000 |
Source: Public Records
Tax History Compared to Growth
Tax History
| Year | Tax Paid | Tax Assessment Tax Assessment Total Assessment is a certain percentage of the fair market value that is determined by local assessors to be the total taxable value of land and additions on the property. | Land | Improvement |
|---|---|---|---|---|
| 2024 | $14,215 | $1,302,203 | $937,274 | $364,929 |
| 2023 | $14,186 | $1,276,670 | $918,896 | $357,774 |
| 2022 | $13,859 | $1,251,638 | $900,879 | $350,759 |
| 2021 | $13,535 | $1,227,097 | $883,215 | $343,882 |
| 2020 | $13,330 | $1,214,515 | $874,159 | $340,356 |
| 2019 | $13,077 | $1,190,701 | $857,018 | $333,683 |
| 2018 | $12,808 | $1,167,354 | $840,213 | $327,141 |
| 2017 | $13,117 | $1,144,465 | $823,738 | $320,727 |
| 2016 | $13,419 | $1,122,025 | $807,586 | $314,439 |
| 2015 | $13,205 | $1,105,172 | $795,456 | $309,716 |
| 2014 | $12,964 | $1,083,524 | $779,874 | $303,650 |
Source: Public Records
Map
Nearby Homes
- 622 Mystic Way
- 1223 Skyline Dr
- 535 Mystic Way
- 346 Y Place
- 680 Virginia Park Dr
- 660 Virginia Park Dr
- 370 Loma Terrace
- 1061 Skyline Dr
- 1040 Skyline Dr
- 1380 Skyline Dr
- 134 High Dr
- 135 High Dr
- 385 Mermaid St
- 556 Through St
- 1425 Skyline Dr
- 1415 Coral Dr
- 153 Cedar Way
- 615 Griffith Way
- 150 Cliff Dr
- 645 Griffith Way
- 1250 Anacapa Way
- 1260 Anacapa Way
- 1248 Anacapa Way
- 645 Mystic Way
- 639 Mystic Way
- 1224 Coronado Dr
- 1234 Coronado Dr
- 1264 Anacapa Way
- 1244 Anacapa Way
- 655 Mystic Way
- 1244 Coronado Dr
- 612 Vista Ln
- 625 Mystic Way
- 616 Vista Ln
- 1218 Coronado Dr
- 1268 Anacapa Way
- 608 Vista Ln
- 1235 Skyline Dr
- 1238 Anacapa Way
- 661 Mystic Way