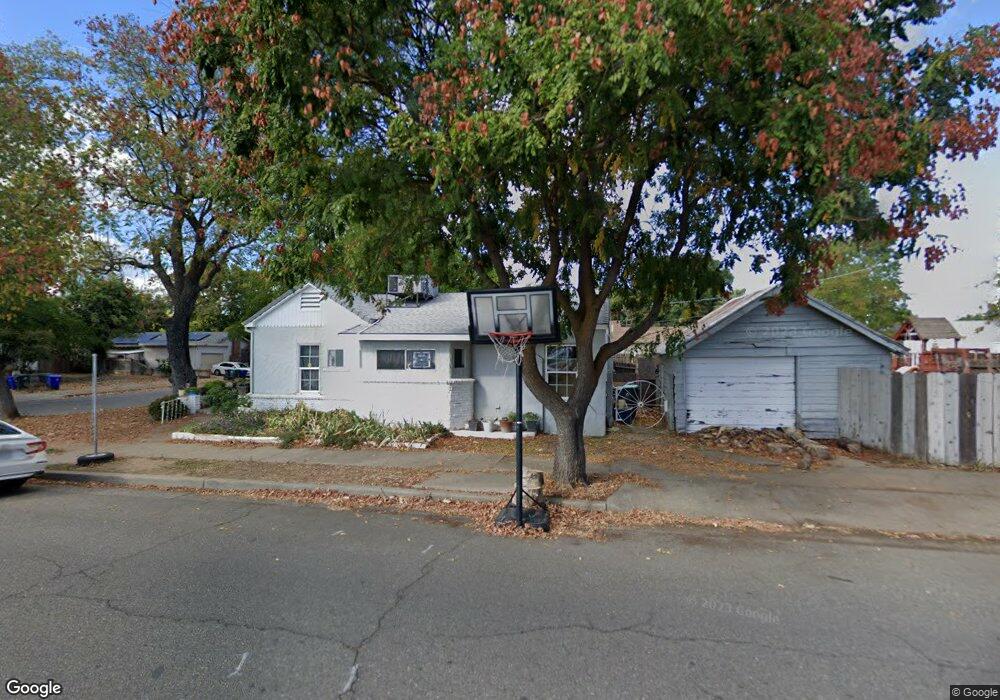
1250 Douglas St Red Bluff, CA 96080
Estimated Value: $217,000 - $255,000
3
Beds
2
Baths
1,228
Sq Ft
$196/Sq Ft
Est. Value
About This Home
This home is located at 1250 Douglas St, Red Bluff, CA 96080 and is currently estimated at $240,183, approximately $195 per square foot. 1250 Douglas St is a home located in Tehama County with nearby schools including Bidwell Elementary School, Vista Preparatory Academy, and Red Bluff High School.
Ownership History
Date
Name
Owned For
Owner Type
Purchase Details
Closed on
Nov 14, 2011
Sold by
Cassidy Paul Bernard and Cassidy Nancy Seneretta
Bought by
Cassidy Paul B and Cassidy Nancy S
Current Estimated Value
Purchase Details
Closed on
Oct 27, 2010
Sold by
Colombo Rosalie A and Colombo Mark
Bought by
Cassidy Paul Bernard and Cassidy Nancy Seneretta
Purchase Details
Closed on
Feb 4, 2010
Sold by
Landavazo Stephen
Bought by
Colombo Rosalie A and Colombo Mark
Purchase Details
Closed on
Nov 19, 2008
Sold by
Landavazo Barbara
Bought by
Landavazo Steve
Home Financials for this Owner
Home Financials are based on the most recent Mortgage that was taken out on this home.
Original Mortgage
$91,000
Interest Rate
5.9%
Mortgage Type
New Conventional
Purchase Details
Closed on
May 28, 2002
Sold by
Eaton Lena Louise
Bought by
Eaton Lena Louise
Create a Home Valuation Report for This Property
The Home Valuation Report is an in-depth analysis detailing your home's value as well as a comparison with similar homes in the area
Purchase History
| Date | Buyer | Sale Price | Title Company |
|---|---|---|---|
| Cassidy Paul B | -- | None Available | |
| Cassidy Paul Bernard | $105,000 | Placer Title Company | |
| Colombo Rosalie A | $3,000 | Placer Title Company | |
| Colombo Rosalie A | -- | Placer Title Company | |
| Landavazo Steve | -- | Placer Title Company | |
| Landavazo Stephen | $98,500 | Placer Title Company | |
| Colombo Rosalie A | -- | Placer Title Company | |
| Eaton Lena Louise | -- | -- |
Source: Public Records
Mortgage History
| Date | Status | Borrower | Loan Amount |
|---|---|---|---|
| Previous Owner | Landavazo Steve | $91,000 |
Source: Public Records
Tax History
| Year | Tax Paid | Tax Assessment Tax Assessment Total Assessment is a certain percentage of the fair market value that is determined by local assessors to be the total taxable value of land and additions on the property. | Land | Improvement |
|---|---|---|---|---|
| 2025 | $1,370 | $134,512 | $38,430 | $96,082 |
| 2023 | $1,347 | $129,291 | $36,939 | $92,352 |
| 2022 | $1,338 | $126,757 | $36,215 | $90,542 |
| 2021 | $1,285 | $124,272 | $35,505 | $88,767 |
| 2020 | $1,311 | $122,998 | $35,141 | $87,857 |
| 2019 | $1,320 | $120,587 | $34,452 | $86,135 |
| 2018 | $1,220 | $118,224 | $33,777 | $84,447 |
| 2017 | $1,231 | $115,907 | $33,115 | $82,792 |
| 2016 | $1,150 | $113,635 | $32,466 | $81,169 |
| 2015 | -- | $111,929 | $31,979 | $79,950 |
| 2014 | $1,116 | $109,737 | $31,353 | $78,384 |
Source: Public Records
Map
Nearby Homes
- 1359 2nd St
- 1356 Park Ave
- 1426 Lincoln St
- 1313 Jackson St
- 1500 Walbridge St
- 1549 Jackson St
- 927 Cedar St
- 1707 Luning St
- 1710 Luning St
- 1715 Walbridge St
- 1835 Douglass St
- 605 Breckenridge St
- 1158 Madison St
- 0 Derby Unit 24724349
- 728 Lincoln St
- 545 Cedar St
- 0 Jefferson St Unit SN26036140
- 1402 Scottsdale Way
- 2132 Reta Way
- 532 Madison St
Your Personal Tour Guide
Ask me questions while you tour the home.