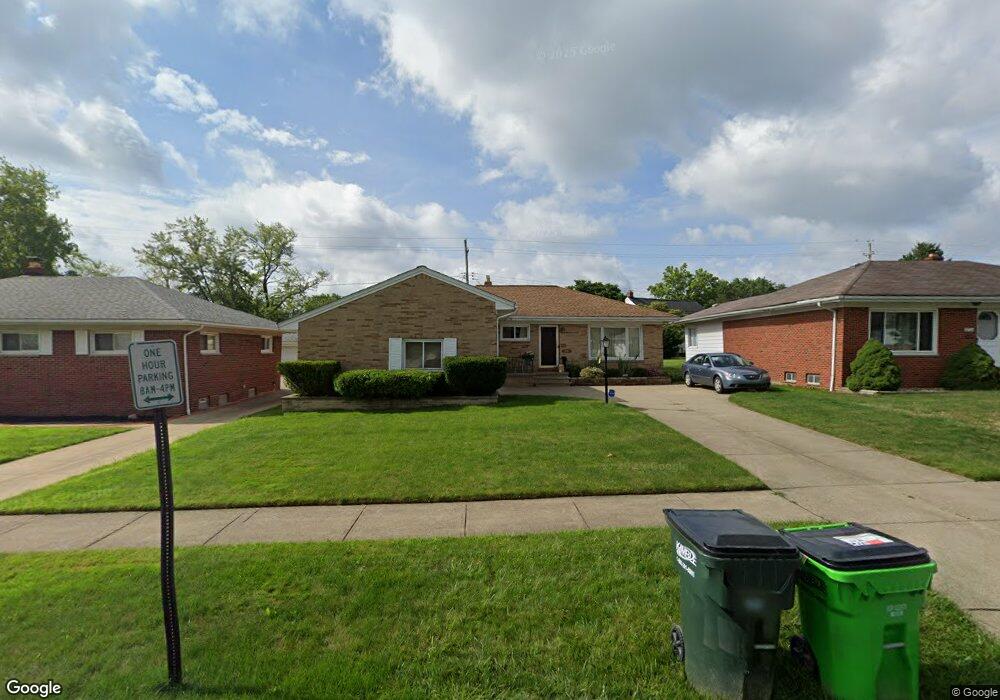
12508 Oakview Blvd Cleveland, OH 44125
Estimated Value: $155,262 - $214,000
3
Beds
1
Bath
1,276
Sq Ft
$136/Sq Ft
Est. Value
About This Home
This home is located at 12508 Oakview Blvd, Cleveland, OH 44125 and is currently estimated at $173,066, approximately $135 per square foot. 12508 Oakview Blvd is a home located in Cuyahoga County with nearby schools including Garfield Heights High School, North Shore High School, and St Benedict Catholic School.
Ownership History
Date
Name
Owned For
Owner Type
Purchase Details
Closed on
Oct 7, 2002
Sold by
Koran Spencer H and Koran Shirley A
Bought by
Macon Radford and Macon Kimberly M
Current Estimated Value
Home Financials for this Owner
Home Financials are based on the most recent Mortgage that was taken out on this home.
Original Mortgage
$121,505
Outstanding Balance
$51,610
Interest Rate
6.34%
Estimated Equity
$121,456
Purchase Details
Closed on
Aug 8, 2000
Sold by
Funtash Helen M
Bought by
Koran Spencer H and Koran Shirley A
Home Financials for this Owner
Home Financials are based on the most recent Mortgage that was taken out on this home.
Original Mortgage
$15,500
Interest Rate
8.12%
Purchase Details
Closed on
Mar 12, 1985
Sold by
Funtash Steven F and Funtash Helen M
Bought by
Funtash Stephen F
Purchase Details
Closed on
Jan 1, 1975
Bought by
Funtash Steven F and Funtash Helen M
Create a Home Valuation Report for This Property
The Home Valuation Report is an in-depth analysis detailing your home's value as well as a comparison with similar homes in the area
Home Values in the Area
Average Home Value in this Area
Purchase History
| Date | Buyer | Sale Price | Title Company |
|---|---|---|---|
| Macon Radford | $127,900 | First Partners Title | |
| Koran Spencer H | $117,000 | Executive Title Agency Corp | |
| Funtash Stephen F | -- | -- | |
| Funtash Steven F | -- | -- |
Source: Public Records
Mortgage History
| Date | Status | Borrower | Loan Amount |
|---|---|---|---|
| Open | Macon Radford | $121,505 | |
| Closed | Koran Spencer H | $15,500 |
Source: Public Records
Tax History Compared to Growth
Tax History
| Year | Tax Paid | Tax Assessment Tax Assessment Total Assessment is a certain percentage of the fair market value that is determined by local assessors to be the total taxable value of land and additions on the property. | Land | Improvement |
|---|---|---|---|---|
| 2024 | $4,975 | $48,790 | $9,695 | $39,095 |
| 2023 | $4,072 | $36,900 | $6,970 | $29,930 |
| 2022 | $4,012 | $36,890 | $6,970 | $29,930 |
| 2021 | $4,241 | $36,890 | $6,970 | $29,930 |
| 2020 | $3,638 | $29,510 | $5,570 | $23,940 |
| 2019 | $3,606 | $84,300 | $15,900 | $68,400 |
| 2018 | $3,610 | $29,510 | $5,570 | $23,940 |
| 2017 | $3,645 | $28,000 | $4,620 | $23,380 |
| 2016 | $3,699 | $28,000 | $4,620 | $23,380 |
| 2015 | $3,554 | $28,000 | $4,620 | $23,380 |
| 2014 | $3,554 | $29,480 | $4,870 | $24,610 |
Source: Public Records
Map
Nearby Homes
- 12512 York Blvd
- 12313 Eastwood Blvd
- 12214 Woodward Blvd
- 5781 Turney Rd
- 12324 Oak Park Blvd
- 11808 Fordham Rd
- 5817 Turney Rd
- 12912 Thraves Rd
- 12813 Oak Park Blvd
- 5584 Turney Rd
- 13012 Oak Park Blvd
- 13009 Oak Park Blvd
- 13206 Shady Oak Blvd
- 13405 York Blvd
- 13009 Orme Rd
- 13300 Shady Oak Blvd
- 12913 Darlington Ave
- 12025 Orme Rd
- 13402 Shady Oak Blvd
- 12804 Havana Rd
- 12504 Oakview Blvd
- 12512 Oakview Blvd
- 12505 Fairlawn Blvd
- 12500 Oakview Blvd
- 12600 Oakview Blvd
- 12501 Maple Leaf Dr
- 12412 Oakview Blvd
- 12417 Maple Leaf Dr
- 12509 Oakview Blvd
- 12505 Oakview Blvd
- 12513 Oakview Blvd
- 12501 Oakview Blvd
- 12517 Maple Leaf Dr
- 12517 Oakview Blvd
- 12408 Oakview Blvd
- 12413 Maple Leaf Dr
- 12417 Oakview Blvd
- 12601 Oakview Blvd
- 12413 Oakview Blvd
- 12404 Oakview Blvd