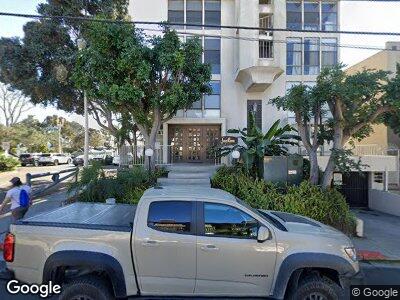
1251 Parker Place Unit 2I San Diego, CA 92109
Pacific Beach NeighborhoodEstimated Value: $819,000 - $1,021,000
2
Beds
2
Baths
971
Sq Ft
$982/Sq Ft
Est. Value
About This Home
This home is located at 1251 Parker Place Unit 2I, San Diego, CA 92109 and is currently estimated at $953,882, approximately $982 per square foot. 1251 Parker Place Unit 2I is a home located in San Diego County with nearby schools including Crown Point Junior Music Academy, Pacific Beach Middle, and Mission Bay High School.
Ownership History
Date
Name
Owned For
Owner Type
Purchase Details
Closed on
Feb 3, 1998
Sold by
Leuthold Richard R and Leuthold Janet S
Bought by
Graham Kristin
Current Estimated Value
Home Financials for this Owner
Home Financials are based on the most recent Mortgage that was taken out on this home.
Original Mortgage
$140,000
Interest Rate
3.5%
Purchase Details
Closed on
Oct 24, 1995
Sold by
Braasch Marc and Braasch Darlene
Bought by
Leuthold Richard R and Leuthold Janet S
Home Financials for this Owner
Home Financials are based on the most recent Mortgage that was taken out on this home.
Original Mortgage
$134,000
Interest Rate
6.98%
Purchase Details
Closed on
Dec 27, 1989
Purchase Details
Closed on
Nov 18, 1983
Create a Home Valuation Report for This Property
The Home Valuation Report is an in-depth analysis detailing your home's value as well as a comparison with similar homes in the area
Home Values in the Area
Average Home Value in this Area
Purchase History
| Date | Buyer | Sale Price | Title Company |
|---|---|---|---|
| Graham Kristin | $175,000 | Chicago Title Co | |
| Leuthold Richard R | $167,500 | First American Title | |
| -- | $155,000 | -- | |
| -- | $118,000 | -- |
Source: Public Records
Mortgage History
| Date | Status | Borrower | Loan Amount |
|---|---|---|---|
| Previous Owner | Graham Kristin | $140,000 | |
| Previous Owner | Leuthold Richard R | $134,000 |
Source: Public Records
Tax History Compared to Growth
Tax History
| Year | Tax Paid | Tax Assessment Tax Assessment Total Assessment is a certain percentage of the fair market value that is determined by local assessors to be the total taxable value of land and additions on the property. | Land | Improvement |
|---|---|---|---|---|
| 2024 | $3,386 | $273,145 | $140,880 | $132,265 |
| 2023 | $3,312 | $267,790 | $138,118 | $129,672 |
| 2022 | $3,224 | $262,540 | $135,410 | $127,130 |
| 2021 | $3,202 | $257,393 | $132,755 | $124,638 |
| 2020 | $3,163 | $254,754 | $131,394 | $123,360 |
| 2019 | $3,107 | $249,760 | $128,818 | $120,942 |
| 2018 | $2,906 | $244,864 | $126,293 | $118,571 |
| 2017 | $80 | $240,064 | $123,817 | $116,247 |
| 2016 | $2,792 | $235,358 | $121,390 | $113,968 |
| 2015 | $2,751 | $231,824 | $119,567 | $112,257 |
| 2014 | $2,708 | $227,284 | $117,225 | $110,059 |
Source: Public Records
Map
Nearby Homes
- 1251 Parker Place Unit 1A
- 1251 Parker Place Unit 2J
- 1235 Parker Place Unit 2H
- 4007 Everts St Unit 4H
- 1177 Pacific Beach Dr Unit A
- 4016 Gresham St Unit B3
- 1145 Pacific Beach Dr Unit 107
- 3940 Gresham St Unit 251
- 4071 Riviera Dr
- 1119 Reed Ave Unit 4
- 3920 Riviera Dr Unit H
- 3916 Riviera Dr Unit 605
- 1215 Grand Ave
- 1523-25 Oliver Ave
- 3850 Riviera Dr Unit 3B
- 3828 Riviera Dr Unit 2B
- 4111 Bayard St
- 1369 Hornblend St
- 1419 Hornblend St Unit 3
- 1656 Pacific Beach Dr
- 1251 Parker Place Unit J
- 1251 Parker Place
- 1251 Parker Place Unit 2K
- 1251 Parker Place Unit 2I
- 1251 Parker Place Unit 2G
- 1251 Parker Place Unit 2E
- 1251 Parker Place Unit 2C
- 1251 Parker Place Unit 2B
- 1251 Parker Place Unit 1B
- 1251 Parker Place Unit 2F
- 1251 Parker Place Unit 2H
- 1251 Parker Place Unit 2L
- 1251 Parker Place Unit 1D
- 1251 Parker Place Unit 1C
- 1251 Parker Place Unit 4C
- 1251 Parker Place Unit 4D
- 1251 Parker Place Unit 4B
- 1251 Parker Place Unit 4A
- 1251 Parker Place Unit 3A
- 1251 Parker Place Unit 3B