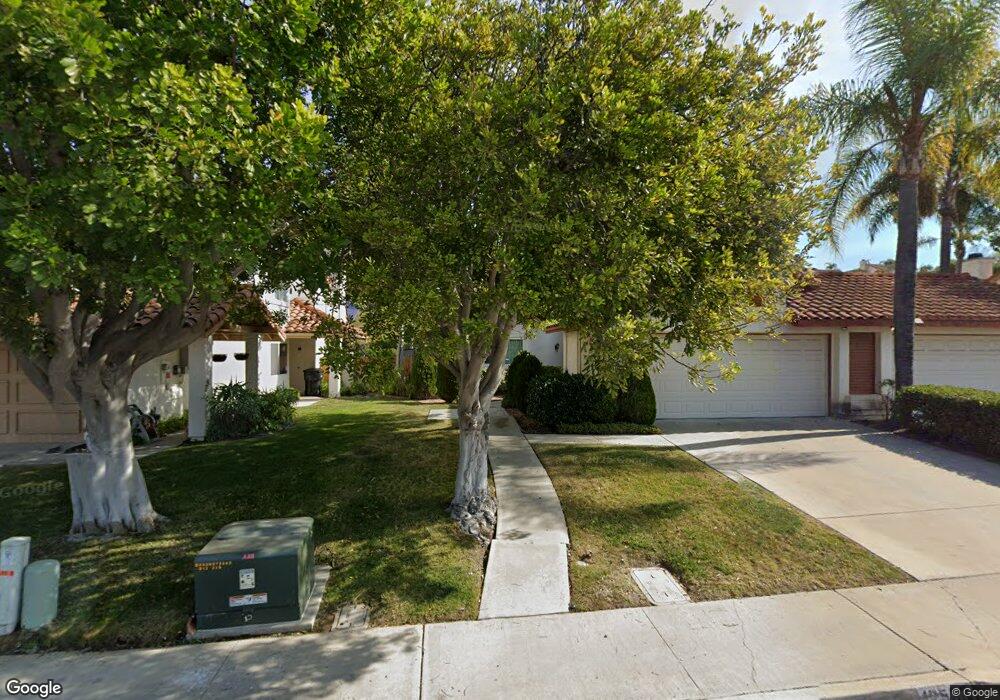
12533 Spindletop Rd San Diego, CA 92129
Rancho Peñasquitos NeighborhoodEstimated Value: $944,000 - $1,208,000
2
Beds
2
Baths
1,127
Sq Ft
$957/Sq Ft
Est. Value
About This Home
This home is located at 12533 Spindletop Rd, San Diego, CA 92129 and is currently estimated at $1,078,687, approximately $957 per square foot. 12533 Spindletop Rd is a home located in San Diego County with nearby schools including Park Village Elementary School, Mesa Verde Middle School, and Westview High School.
Ownership History
Date
Name
Owned For
Owner Type
Purchase Details
Closed on
Aug 23, 2024
Sold by
Graff Eric Carl and Graff Jeanine A
Bought by
Graff Family Trust and Graff
Current Estimated Value
Purchase Details
Closed on
Apr 30, 2009
Sold by
Graff Eric C and Graff Jeanine A Spear
Bought by
Graff Eric C and Graff Jeanine A
Home Financials for this Owner
Home Financials are based on the most recent Mortgage that was taken out on this home.
Original Mortgage
$275,000
Interest Rate
4.99%
Mortgage Type
New Conventional
Purchase Details
Closed on
May 9, 2002
Sold by
Aguirre Oscar and Aguirre Antonia D
Bought by
Aguirre Oscar and Aguirre Antonia D
Purchase Details
Closed on
Aug 5, 1999
Sold by
Loescher Jon M and Loescher Carol G
Bought by
Aguirre Oscar and Aguirre Antonia D
Home Financials for this Owner
Home Financials are based on the most recent Mortgage that was taken out on this home.
Original Mortgage
$164,000
Interest Rate
7.25%
Purchase Details
Closed on
Jan 30, 1987
Create a Home Valuation Report for This Property
The Home Valuation Report is an in-depth analysis detailing your home's value as well as a comparison with similar homes in the area
Home Values in the Area
Average Home Value in this Area
Purchase History
| Date | Buyer | Sale Price | Title Company |
|---|---|---|---|
| Graff Family Trust | -- | None Listed On Document | |
| Graff Eric C | -- | Corinthian Title | |
| Aguirre Oscar | -- | -- | |
| Aguirre Oscar | $205,000 | Lawyers Title | |
| -- | $116,400 | -- |
Source: Public Records
Mortgage History
| Date | Status | Borrower | Loan Amount |
|---|---|---|---|
| Previous Owner | Graff Eric C | $275,000 | |
| Previous Owner | Aguirre Oscar | $164,000 |
Source: Public Records
Tax History Compared to Growth
Tax History
| Year | Tax Paid | Tax Assessment Tax Assessment Total Assessment is a certain percentage of the fair market value that is determined by local assessors to be the total taxable value of land and additions on the property. | Land | Improvement |
|---|---|---|---|---|
| 2025 | $5,314 | $485,180 | $231,727 | $253,453 |
| 2024 | $5,314 | $475,668 | $227,184 | $248,484 |
| 2023 | $5,198 | $466,342 | $222,730 | $243,612 |
| 2022 | $5,101 | $457,199 | $218,363 | $238,836 |
| 2021 | $5,032 | $448,235 | $214,082 | $234,153 |
| 2020 | $4,966 | $443,640 | $211,887 | $231,753 |
| 2019 | $4,849 | $434,942 | $207,733 | $227,209 |
| 2018 | $4,730 | $426,414 | $203,660 | $222,754 |
| 2017 | $83 | $418,054 | $199,667 | $218,387 |
| 2016 | $4,485 | $409,857 | $195,752 | $214,105 |
| 2015 | $4,406 | $403,701 | $192,812 | $210,889 |
| 2014 | $4,302 | $395,794 | $189,036 | $206,758 |
Source: Public Records
Map
Nearby Homes
- 12537 Ginger Snap Ct
- 8695 Rideabout Ln
- 12573 Brickellia St
- 9012 Buckwheat St
- 8754 Park Run Rd
- 8672 Creekwood Ln
- 12776 Isocoma St Unit 4
- 9068 Buckwheat St
- 12518 Darkwood Rd
- 12880 War Horse St
- 12465 Pathos Ln
- 12740 Prairie Dog Ave
- 12485 Picrus St
- 13146 Thunderhead St
- 9342 Twin Trails Dr Unit 303
- 9302 Twin Trails Dr Unit 204
- 9446 Pipilo St
- 9525 Vervain St
- 9458 Twin Trails Dr Unit 205
- 13202 Salmon River Rd Unit 101
- 12539 Spindletop Rd
- 12527 Spindletop Rd
- 12545 Spindletop Rd
- 12521 Spindletop Rd
- 12551 Spindletop Rd
- 12515 Spindletop Rd
- 8796 Ginger Snap Ln
- 12557 Spindletop Rd
- 12509 Spindletop Rd
- 12904 Texana St
- 8790 Ginger Snap Ln
- 12563 Spindletop Rd
- 12898 Texana St
- 12540 Spindletop Rd
- 8797 Ginger Snap Ln
- 12892 Texana St
- 12916 Texana St
- 12550 Spindletop Rd
- 12569 Spindletop Rd
- 8791 Ginger Snap Ln