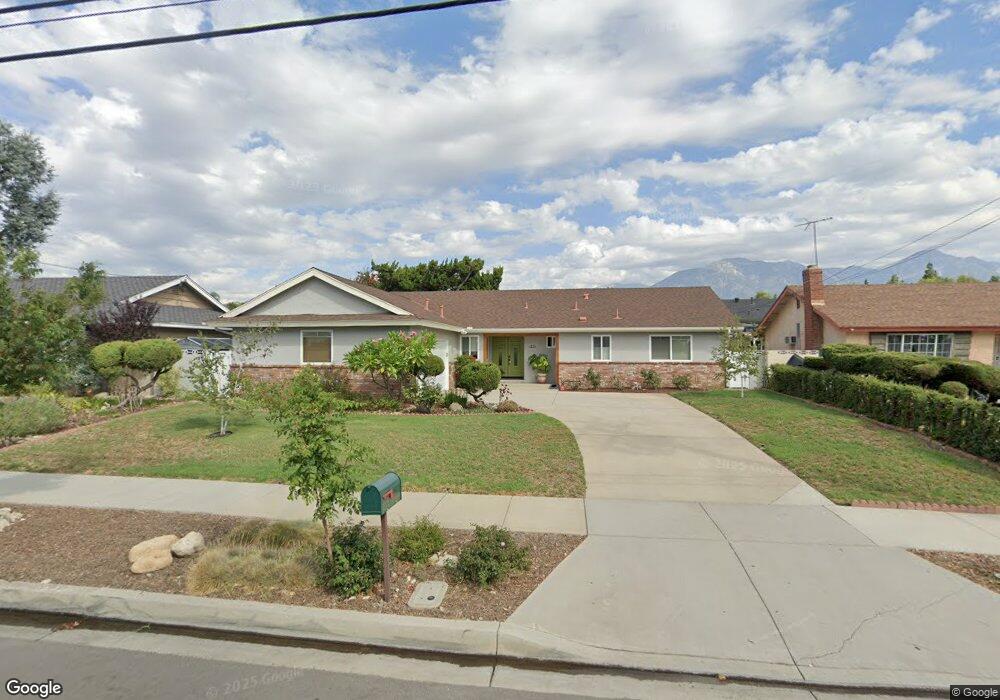
1255 W 13th St Upland, CA 91786
Estimated Value: $777,743 - $836,000
3
Beds
2
Baths
1,689
Sq Ft
$477/Sq Ft
Est. Value
About This Home
This home is located at 1255 W 13th St, Upland, CA 91786 and is currently estimated at $806,186, approximately $477 per square foot. 1255 W 13th St is a home located in San Bernardino County with nearby schools including Sycamore Elementary, Pioneer Junior High School, and Upland High School.
Ownership History
Date
Name
Owned For
Owner Type
Purchase Details
Closed on
Dec 13, 2023
Sold by
Mora Sergio and Mora Janette
Bought by
Mora Living Trust and Mora
Current Estimated Value
Purchase Details
Closed on
Oct 11, 2006
Sold by
Mora Sergio
Bought by
Mora Sergio and Mora Janette
Home Financials for this Owner
Home Financials are based on the most recent Mortgage that was taken out on this home.
Original Mortgage
$358,500
Interest Rate
6.39%
Mortgage Type
New Conventional
Purchase Details
Closed on
Feb 12, 2004
Sold by
Kern Pauline M
Bought by
Mora Sergio and Agredano Janette
Home Financials for this Owner
Home Financials are based on the most recent Mortgage that was taken out on this home.
Original Mortgage
$300,000
Interest Rate
4%
Mortgage Type
Purchase Money Mortgage
Purchase Details
Closed on
Oct 9, 2000
Sold by
Kern Pauline M
Bought by
Kern Pauline M and Pauline M Kern 2000 Revocable
Create a Home Valuation Report for This Property
The Home Valuation Report is an in-depth analysis detailing your home's value as well as a comparison with similar homes in the area
Home Values in the Area
Average Home Value in this Area
Purchase History
| Date | Buyer | Sale Price | Title Company |
|---|---|---|---|
| Mora Living Trust | -- | None Listed On Document | |
| Mora Sergio | -- | North American Title Company | |
| Mora Sergio | $375,000 | -- | |
| Kern Pauline M | -- | -- |
Source: Public Records
Mortgage History
| Date | Status | Borrower | Loan Amount |
|---|---|---|---|
| Previous Owner | Mora Sergio | $358,500 | |
| Previous Owner | Mora Sergio | $300,000 | |
| Closed | Mora Sergio | $75,000 |
Source: Public Records
Tax History Compared to Growth
Tax History
| Year | Tax Paid | Tax Assessment Tax Assessment Total Assessment is a certain percentage of the fair market value that is determined by local assessors to be the total taxable value of land and additions on the property. | Land | Improvement |
|---|---|---|---|---|
| 2025 | $5,666 | $533,177 | $186,613 | $346,564 |
| 2024 | $5,666 | $522,723 | $182,954 | $339,769 |
| 2023 | $5,579 | $512,474 | $179,367 | $333,107 |
| 2022 | $5,458 | $502,425 | $175,850 | $326,575 |
| 2021 | $5,450 | $492,574 | $172,402 | $320,172 |
| 2020 | $5,302 | $487,523 | $170,634 | $316,889 |
| 2019 | $5,283 | $477,963 | $167,288 | $310,675 |
| 2018 | $5,153 | $468,591 | $164,008 | $304,583 |
| 2017 | $5,003 | $459,403 | $160,792 | $298,611 |
| 2016 | $4,783 | $450,395 | $157,639 | $292,756 |
| 2015 | $4,673 | $443,630 | $155,271 | $288,359 |
| 2014 | $4,552 | $434,939 | $152,229 | $282,710 |
Source: Public Records
Map
Nearby Homes
- 1193 W 13th St
- 1090 Springfield St
- 1486 Florence Ct
- 1480 Amsterdam Ct Unit 7
- 1400 W 13th St
- 1400 W 13th St Unit 1
- 1400 W 13th St Unit 31
- 1400 W 13th St Unit 66
- 1400 W 13th St Unit 80
- 1400 W 13th St Unit 148
- 1400 W 13th St Unit 208
- 1503 Florence Ct
- 1469 N Erin Ave
- 939 W Pine St Unit 44
- 1340 Waverly Ct
- 1018 Shiba Ct
- 1339 W 11th St
- 880 W Pine St
- 1018 W 15th St
- 681 Birch Ave
- 1247 W 13th St
- 1256 Sandra Ct
- 1266 Sandra Ct
- 1246 Sandra Ct
- 1235 W 13th St
- 1286 Cassel Cir
- 1287 Cassel Cir
- 1236 Sandra Ct
- 1283 W 13th St
- 1272 Cassel Cir Unit 1
- 1225 W 13th St
- 1282 Sandra Ct
- 1269 Crestwood Dr
- 1286 Elizabeth Cir
- 1228 Sandra Ct
- 1237 Crestwood Dr
- 1257 Sandra Ct
- 1245 Sandra Ct
- 1235 Crestwood Dr Unit 2
- 1291 W 13th St