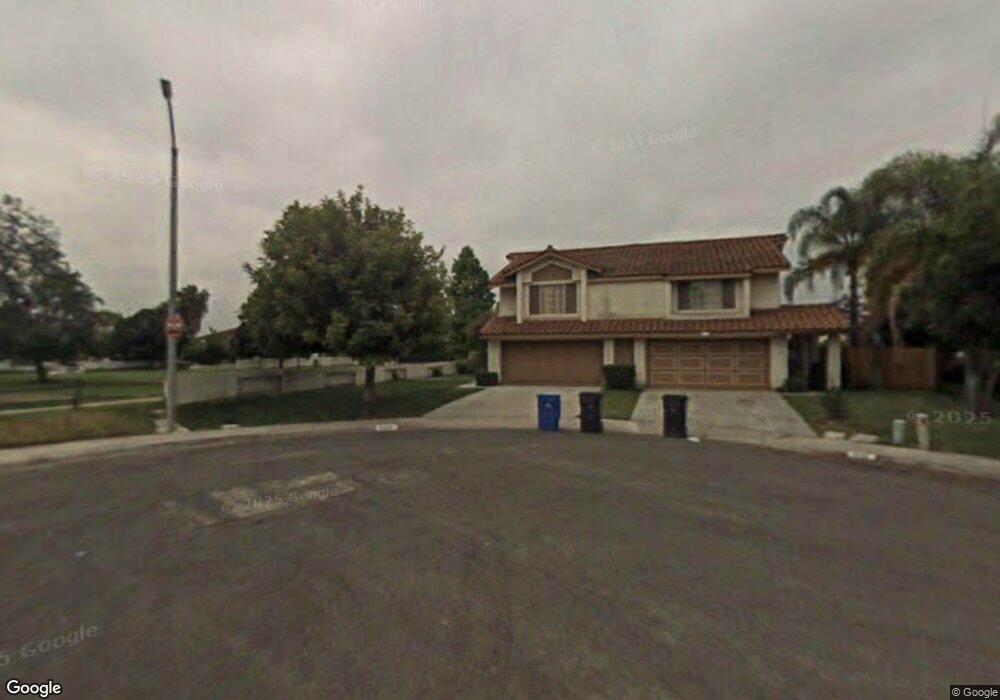
12552 Rideabout Ct Unit 2 San Diego, CA 92129
Rancho Peñasquitos NeighborhoodEstimated Value: $1,073,000 - $1,316,000
3
Beds
3
Baths
1,439
Sq Ft
$818/Sq Ft
Est. Value
About This Home
This home is located at 12552 Rideabout Ct Unit 2, San Diego, CA 92129 and is currently estimated at $1,176,743, approximately $817 per square foot. 12552 Rideabout Ct Unit 2 is a home located in San Diego County with nearby schools including Park Village Elementary School, Mesa Verde Middle School, and Westview High School.
Ownership History
Date
Name
Owned For
Owner Type
Purchase Details
Closed on
May 1, 2008
Sold by
Rashid Nisreen F
Bought by
Rashid Fakhruddin and Rashid Nisreen
Current Estimated Value
Purchase Details
Closed on
Nov 9, 2004
Sold by
Rashid Fakhruddin S
Bought by
Rashid Nisreen F
Purchase Details
Closed on
Oct 7, 2002
Sold by
Schaffer Andrew Paul and Schaffer Gloria Kim
Bought by
Rashid Fakhruddin S and Rashid Nisreen F
Home Financials for this Owner
Home Financials are based on the most recent Mortgage that was taken out on this home.
Original Mortgage
$200,000
Interest Rate
5.99%
Purchase Details
Closed on
Sep 14, 1995
Sold by
Maguire Jeffrey R
Bought by
Schaffer Andrew Paul and Schaffer Gloria Kim
Home Financials for this Owner
Home Financials are based on the most recent Mortgage that was taken out on this home.
Original Mortgage
$170,000
Interest Rate
7.97%
Purchase Details
Closed on
May 2, 1986
Create a Home Valuation Report for This Property
The Home Valuation Report is an in-depth analysis detailing your home's value as well as a comparison with similar homes in the area
Home Values in the Area
Average Home Value in this Area
Purchase History
| Date | Buyer | Sale Price | Title Company |
|---|---|---|---|
| Rashid Fakhruddin | -- | None Available | |
| Rashid Nisreen F | -- | -- | |
| Rasahid Nisreen F | -- | -- | |
| Rashid Fakhruddin S | $353,000 | Chicago Title Co | |
| Schaffer Andrew Paul | $179,000 | Southland Title | |
| -- | $112,000 | -- |
Source: Public Records
Mortgage History
| Date | Status | Borrower | Loan Amount |
|---|---|---|---|
| Closed | Rashid Fakhruddin S | $200,000 | |
| Previous Owner | Schaffer Andrew Paul | $170,000 |
Source: Public Records
Tax History Compared to Growth
Tax History
| Year | Tax Paid | Tax Assessment Tax Assessment Total Assessment is a certain percentage of the fair market value that is determined by local assessors to be the total taxable value of land and additions on the property. | Land | Improvement |
|---|---|---|---|---|
| 2025 | $5,662 | $510,524 | $217,241 | $293,283 |
| 2024 | $5,662 | $500,515 | $212,982 | $287,533 |
| 2023 | $5,540 | $490,702 | $208,806 | $281,896 |
| 2022 | $5,438 | $481,081 | $204,712 | $276,369 |
| 2021 | $5,366 | $471,649 | $200,699 | $270,950 |
| 2020 | $5,297 | $466,814 | $198,642 | $268,172 |
| 2019 | $5,174 | $457,662 | $194,748 | $262,914 |
| 2018 | $5,050 | $448,689 | $190,930 | $257,759 |
| 2017 | $4,902 | $439,892 | $187,187 | $252,705 |
| 2016 | $4,792 | $431,267 | $183,517 | $247,750 |
| 2015 | $4,710 | $424,790 | $180,761 | $244,029 |
| 2014 | $4,600 | $416,470 | $177,221 | $239,249 |
Source: Public Records
Map
Nearby Homes
- 12573 Brickellia St
- 8695 Rideabout Ln
- 8672 Creekwood Ln
- 12537 Ginger Snap Ct
- 12518 Darkwood Rd
- 8754 Park Run Rd
- 12880 War Horse St
- 12740 Prairie Dog Ave
- 9012 Buckwheat St
- 12465 Pathos Ln
- 12485 Picrus St
- 12776 Isocoma St Unit 4
- 9068 Buckwheat St
- 13146 Thunderhead St
- 9342 Twin Trails Dr Unit 303
- 12660 Stella Ln
- 9302 Twin Trails Dr Unit 204
- 9446 Pipilo St
- 9525 Vervain St
- 9458 Twin Trails Dr Unit 205
- 12560 Rideabout Ct Unit 2
- 12568 Rideabout Ct
- 12541 Brickellia St
- 12549 Brickellia St
- 12533 Brickellia St
- 12557 Brickellia St
- 12576 Rideabout Ct
- 12565 Brickellia St
- 12584 Rideabout Ct
- 12565 Rideabout Ct
- 12575 Rideabout Ct Unit 2
- 12592 Rideabout Ct
- 12585 Rideabout Ct
- 12581 Brickellia St
- 8704 Ginger Snap Ln
- 8713 Ginger Snap Ln
- 12595 Rideabout Ct
- 12554 Brickellia St
- 8701 Ginger Snap Ln
- 12546 Brickellia St