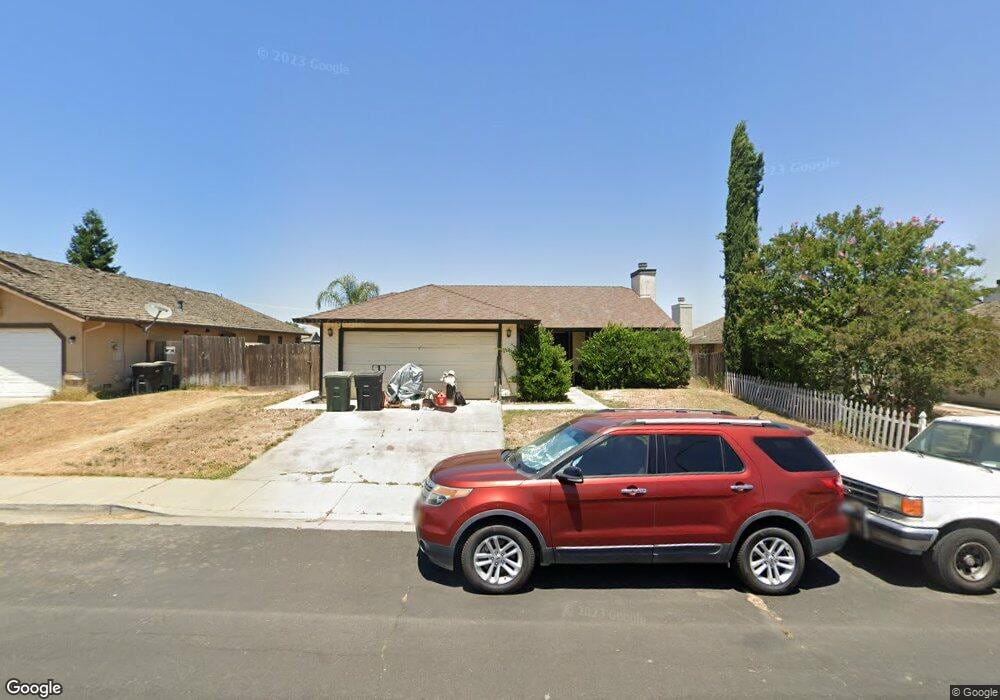
12555 Sean Ct Waterford, CA 95386
Estimated Value: $280,000 - $414,000
3
Beds
2
Baths
1,135
Sq Ft
$325/Sq Ft
Est. Value
About This Home
This home is located at 12555 Sean Ct, Waterford, CA 95386 and is currently estimated at $368,957, approximately $325 per square foot. 12555 Sean Ct is a home located in Stanislaus County with nearby schools including Lucille Whitehead Intermediate School, Richard M. Moon Primary School, and Waterford Junior.
Ownership History
Date
Name
Owned For
Owner Type
Purchase Details
Closed on
Sep 1, 2000
Sold by
Nelson Thomas W and Nelson Lori
Bought by
May Helen A
Current Estimated Value
Home Financials for this Owner
Home Financials are based on the most recent Mortgage that was taken out on this home.
Original Mortgage
$116,222
Outstanding Balance
$41,695
Interest Rate
8.07%
Mortgage Type
FHA
Estimated Equity
$327,262
Purchase Details
Closed on
Jan 27, 1999
Sold by
Rose George and Marmon Richard
Bought by
Nelson Thomas W and Nelson Lori
Home Financials for this Owner
Home Financials are based on the most recent Mortgage that was taken out on this home.
Original Mortgage
$54,000
Interest Rate
6.78%
Purchase Details
Closed on
Aug 6, 1997
Sold by
H and Cantoni Attilio Martha L
Bought by
Rose George and Marmon Richard
Home Financials for this Owner
Home Financials are based on the most recent Mortgage that was taken out on this home.
Original Mortgage
$39,010
Interest Rate
6.91%
Mortgage Type
Construction
Create a Home Valuation Report for This Property
The Home Valuation Report is an in-depth analysis detailing your home's value as well as a comparison with similar homes in the area
Home Values in the Area
Average Home Value in this Area
Purchase History
| Date | Buyer | Sale Price | Title Company |
|---|---|---|---|
| May Helen A | $117,000 | Fidelity National Title Co | |
| Nelson Thomas W | $94,000 | Chicago Title Co | |
| Rose George | $47,500 | Chicago Title Co |
Source: Public Records
Mortgage History
| Date | Status | Borrower | Loan Amount |
|---|---|---|---|
| Open | May Helen A | $116,222 | |
| Previous Owner | Nelson Thomas W | $54,000 | |
| Previous Owner | Rose George | $39,010 | |
| Closed | Rose George | $18,953 |
Source: Public Records
Tax History Compared to Growth
Tax History
| Year | Tax Paid | Tax Assessment Tax Assessment Total Assessment is a certain percentage of the fair market value that is determined by local assessors to be the total taxable value of land and additions on the property. | Land | Improvement |
|---|---|---|---|---|
| 2025 | $2,261 | $176,279 | $37,658 | $138,621 |
| 2024 | $2,221 | $172,823 | $36,920 | $135,903 |
| 2023 | $2,166 | $169,436 | $36,197 | $133,239 |
| 2022 | $2,130 | $166,115 | $35,488 | $130,627 |
| 2021 | $2,120 | $162,859 | $34,793 | $128,066 |
| 2020 | $2,090 | $161,190 | $34,437 | $126,753 |
| 2019 | $2,062 | $158,030 | $33,762 | $124,268 |
| 2018 | $2,034 | $154,932 | $33,100 | $121,832 |
| 2017 | $1,990 | $151,895 | $32,451 | $119,444 |
| 2016 | $1,953 | $148,917 | $31,815 | $117,102 |
| 2015 | $1,926 | $146,682 | $31,338 | $115,344 |
| 2014 | $1,922 | $143,810 | $30,725 | $113,085 |
Source: Public Records
Map
Nearby Homes
- 579 F St
- 12717 Welch St
- 12716 Bentley St
- 207 Church St
- 220 N Western Ave
- 13112 Rivercrest Dr
- 505 D St
- 328 Burns Creek Ct
- 12356 Rose Way
- 229 Petichia Place
- 410 Pamona St
- 13295 Aura Ln
- 12933 Main St
- 524 N Western Ave
- 12084 Royal Ct
- 12795 Bonnie Brae Ave
- 13317 Fountain Dr
- 680 Loch Ness Dr
- 13362 Welch St
- 13163 Enid Dr