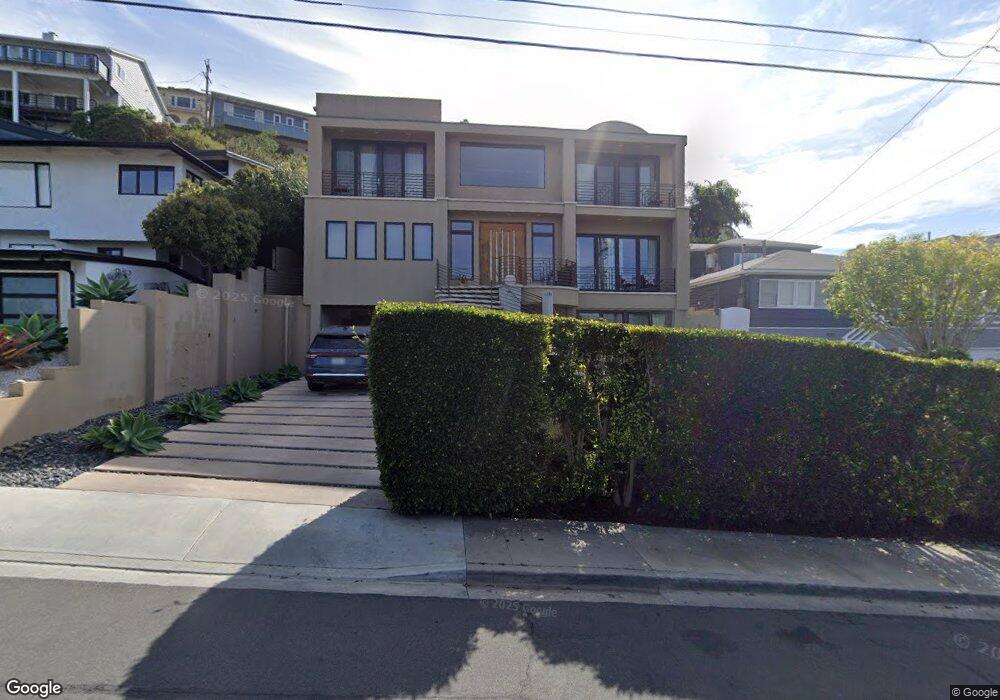
1259 Olivet St La Jolla, CA 92037
The Village NeighborhoodEstimated Value: $3,773,000 - $4,681,000
4
Beds
4
Baths
3,367
Sq Ft
$1,231/Sq Ft
Est. Value
About This Home
This home is located at 1259 Olivet St, La Jolla, CA 92037 and is currently estimated at $4,144,303, approximately $1,230 per square foot. 1259 Olivet St is a home located in San Diego County with nearby schools including La Jolla Elementary School, Muirlands Middle School, and La Jolla High School.
Ownership History
Date
Name
Owned For
Owner Type
Purchase Details
Closed on
Feb 3, 2010
Sold by
Aharpour Esmail and Aharpour Zahra Raissi
Bought by
Aharpour Esmail and Aharpour Zahra
Current Estimated Value
Purchase Details
Closed on
Oct 8, 1997
Sold by
Lew Doris A and Falls John R
Bought by
Aharpour Esmail and Aharpour Zahra Raissi
Home Financials for this Owner
Home Financials are based on the most recent Mortgage that was taken out on this home.
Original Mortgage
$400,000
Interest Rate
7.22%
Purchase Details
Closed on
Dec 12, 1995
Sold by
Dean Robert A and Dean Melanie C
Bought by
Lew Doris A and Falls John R
Home Financials for this Owner
Home Financials are based on the most recent Mortgage that was taken out on this home.
Original Mortgage
$284,000
Interest Rate
7.37%
Purchase Details
Closed on
Jan 21, 1994
Sold by
Dean Robert A and Dean Melanie C
Bought by
Dean Robert A and Dean Melanie C
Purchase Details
Closed on
Aug 28, 1986
Create a Home Valuation Report for This Property
The Home Valuation Report is an in-depth analysis detailing your home's value as well as a comparison with similar homes in the area
Home Values in the Area
Average Home Value in this Area
Purchase History
| Date | Buyer | Sale Price | Title Company |
|---|---|---|---|
| Aharpour Esmail | -- | None Available | |
| Aharpour Esmail | $539,000 | Fidelity National Title | |
| Lew Doris A | $355,000 | Orange Coast Title Company | |
| Dean Robert A | -- | Fidelity National Title | |
| -- | $270,000 | -- |
Source: Public Records
Mortgage History
| Date | Status | Borrower | Loan Amount |
|---|---|---|---|
| Previous Owner | Aharpour Esmail | $400,000 | |
| Previous Owner | Lew Doris A | $284,000 | |
| Closed | Lew Doris A | $35,500 |
Source: Public Records
Tax History Compared to Growth
Tax History
| Year | Tax Paid | Tax Assessment Tax Assessment Total Assessment is a certain percentage of the fair market value that is determined by local assessors to be the total taxable value of land and additions on the property. | Land | Improvement |
|---|---|---|---|---|
| 2025 | $20,511 | $1,707,822 | $746,944 | $960,878 |
| 2024 | $20,511 | $1,674,337 | $732,299 | $942,038 |
| 2023 | $20,058 | $1,641,508 | $717,941 | $923,567 |
| 2022 | $19,523 | $1,609,322 | $703,864 | $905,458 |
| 2021 | $19,388 | $1,577,767 | $690,063 | $887,704 |
| 2020 | $19,152 | $1,561,590 | $682,988 | $878,602 |
| 2019 | $18,808 | $1,530,972 | $669,597 | $861,375 |
| 2018 | $17,581 | $1,500,954 | $656,468 | $844,486 |
| 2017 | $80 | $1,471,525 | $643,597 | $827,928 |
| 2016 | $16,889 | $1,442,673 | $630,978 | $811,695 |
| 2015 | $16,638 | $1,421,004 | $621,501 | $799,503 |
| 2014 | $16,373 | $1,393,169 | $609,327 | $783,842 |
Source: Public Records
Map
Nearby Homes
- 7569 Pepita Way
- 7505 Pepita Way
- 1138 Virginia Way
- 7651 Country Club Dr
- 1428 Soledad Ave
- 7452 Herschel Ave
- 1461 Virginia Way
- 1586 Crespo Dr
- 7733 Girard Ave Unit 13
- 7601 Eads Ave
- 1040 Genter St Unit 103
- 1040 Genter St Unit 104
- 7757 Eads Ave Unit B7
- 7376 Fay Ave
- 7560 Eads Ave Unit 12
- 7372 Fay Ave
- 1640 Ludington Ln
- 1624 Torrey Pines Rd
- 726 Silver St
- 708 Silver St
- 1253 Olivet St
- 1267 Olivet St
- 7632 Mar Ave
- 7622 Mar Ave
- 1251 Olivet St
- 000 Olivet St Unit A
- 1311 Olivet St
- 7612 Mar Ave
- 7638 Mar Ave
- 1235 Olivet St
- 1299 Virginia Way
- 7644 Mar Ave
- 1227 Olivet St
- 1271 Virginia Way
- 7623 Mar Ave
- 1301 Virginia Way
- 7550 Mar Ave
- 7636 Pepita Way
- 1263 Virginia Way
- 7664 Mar Ave