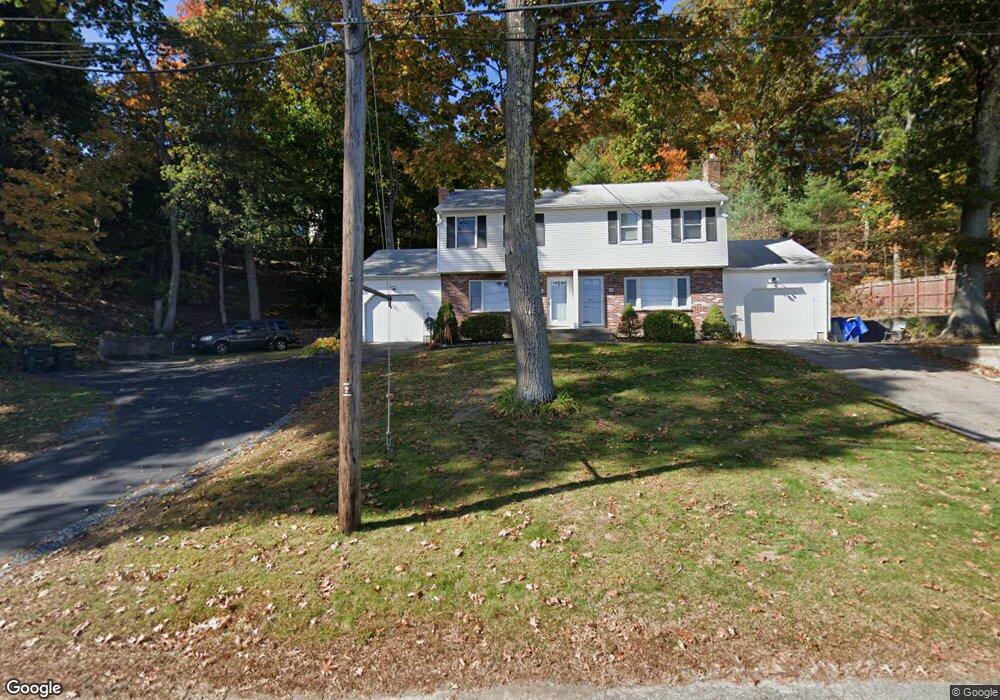
126 Dean Ave Unit 1,1 Franklin, MA 02038
Downtown Franklin NeighborhoodEstimated Value: $378,000 - $404,000
2
Beds
2
Baths
796
Sq Ft
$489/Sq Ft
Est. Value
About This Home
This home is located at 126 Dean Ave Unit 1,1, Franklin, MA 02038 and is currently estimated at $389,375, approximately $489 per square foot. 126 Dean Ave Unit 1,1 is a home located in Norfolk County with nearby schools including Helen Keller Elementary School, Annie Sullivan Middle School, and Franklin High School.
Ownership History
Date
Name
Owned For
Owner Type
Purchase Details
Closed on
Sep 30, 2009
Sold by
Bourque John P and Bourque Marilyn L
Bought by
Polito Michael G
Current Estimated Value
Home Financials for this Owner
Home Financials are based on the most recent Mortgage that was taken out on this home.
Original Mortgage
$158,600
Outstanding Balance
$103,775
Interest Rate
5.12%
Mortgage Type
Purchase Money Mortgage
Estimated Equity
$285,600
Purchase Details
Closed on
Nov 12, 1999
Sold by
Francis Marie
Bought by
Bourque John P and Bourque Marilyn L
Home Financials for this Owner
Home Financials are based on the most recent Mortgage that was taken out on this home.
Original Mortgage
$99,200
Interest Rate
7.68%
Mortgage Type
Purchase Money Mortgage
Purchase Details
Closed on
Apr 3, 1987
Sold by
Park Road Corp
Bought by
Kettenring Calvin
Home Financials for this Owner
Home Financials are based on the most recent Mortgage that was taken out on this home.
Original Mortgage
$101,600
Interest Rate
9.11%
Mortgage Type
Purchase Money Mortgage
Create a Home Valuation Report for This Property
The Home Valuation Report is an in-depth analysis detailing your home's value as well as a comparison with similar homes in the area
Home Values in the Area
Average Home Value in this Area
Purchase History
| Date | Buyer | Sale Price | Title Company |
|---|---|---|---|
| Polito Michael G | $198,350 | -- | |
| Bourque John P | $124,900 | -- | |
| Kettenring Calvin | $112,900 | -- |
Source: Public Records
Mortgage History
| Date | Status | Borrower | Loan Amount |
|---|---|---|---|
| Open | Polito Michael G | $158,600 | |
| Previous Owner | Kettenring Calvin | $99,200 | |
| Previous Owner | Kettenring Calvin | $101,600 |
Source: Public Records
Tax History Compared to Growth
Tax History
| Year | Tax Paid | Tax Assessment Tax Assessment Total Assessment is a certain percentage of the fair market value that is determined by local assessors to be the total taxable value of land and additions on the property. | Land | Improvement |
|---|---|---|---|---|
| 2025 | $3,775 | $324,900 | $0 | $324,900 |
| 2024 | $3,732 | $316,500 | $0 | $316,500 |
| 2023 | $3,680 | $292,500 | $0 | $292,500 |
| 2022 | $3,914 | $278,600 | $0 | $278,600 |
| 2021 | $3,635 | $248,100 | $0 | $248,100 |
| 2020 | $3,475 | $239,500 | $0 | $239,500 |
| 2019 | $2,888 | $197,000 | $0 | $197,000 |
| 2018 | $3,163 | $215,900 | $0 | $215,900 |
| 2017 | $2,477 | $169,900 | $0 | $169,900 |
| 2016 | $2,556 | $176,300 | $0 | $176,300 |
| 2015 | $2,541 | $171,200 | $0 | $171,200 |
| 2014 | $2,325 | $160,900 | $0 | $160,900 |
Source: Public Records
Map
Nearby Homes
- 76 Dean Ave
- 150 Pleasant St
- 67 Milliken Ave Unit 22
- 14 Pleasant St Unit A
- 90 E Central St Unit 103
- 90 E Central St Unit 106
- 90 E Central St Unit 304
- 90 E Central St Unit 202
- 90 E Central St Unit 105
- 90 E Central St Unit 301
- 159 E Central St
- 0 Upper Union St Unit 73230551
- 48 Pinehurst St
- 17 Longhill Rd
- 120 Union St Unit 1
- 40 Cross St
- 266 Pleasant St
- 1 Uncas Ave
- 67 Cottage St
- 99 Summer St