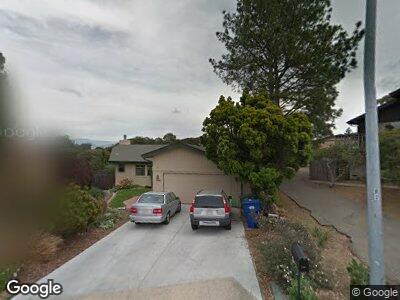
1260 Green Oaks Dr Los Osos, CA 93402
Los Osos NeighborhoodEstimated Value: $1,026,000 - $1,259,000
3
Beds
2
Baths
1,600
Sq Ft
$695/Sq Ft
Est. Value
About This Home
This home is located at 1260 Green Oaks Dr, Los Osos, CA 93402 and is currently estimated at $1,111,928, approximately $694 per square foot. 1260 Green Oaks Dr is a home located in San Luis Obispo County with nearby schools including Monarch Grove Elementary School, Los Osos Middle School, and Morro Bay High School.
Ownership History
Date
Name
Owned For
Owner Type
Purchase Details
Closed on
Aug 22, 2019
Sold by
Nowak Michael
Bought by
Nowak Michael and Harbour Suzette
Current Estimated Value
Purchase Details
Closed on
Jun 13, 2001
Sold by
Harbour Suzette
Bought by
Nowak Michael
Home Financials for this Owner
Home Financials are based on the most recent Mortgage that was taken out on this home.
Original Mortgage
$168,000
Interest Rate
7.15%
Purchase Details
Closed on
May 22, 1996
Sold by
Englund M Sue
Bought by
Nowak Michael
Home Financials for this Owner
Home Financials are based on the most recent Mortgage that was taken out on this home.
Original Mortgage
$175,000
Interest Rate
8.3%
Mortgage Type
Balloon
Create a Home Valuation Report for This Property
The Home Valuation Report is an in-depth analysis detailing your home's value as well as a comparison with similar homes in the area
Home Values in the Area
Average Home Value in this Area
Purchase History
| Date | Buyer | Sale Price | Title Company |
|---|---|---|---|
| Nowak Michael | -- | None Available | |
| Nowak Michael | -- | First American Title Ins Co | |
| Nowak Michael | $230,000 | Chicago Title Co |
Source: Public Records
Mortgage History
| Date | Status | Borrower | Loan Amount |
|---|---|---|---|
| Open | Nowak Michael | $305,000 | |
| Closed | Nowak Michael | $360,000 | |
| Closed | Nowak Michael | $370,000 | |
| Closed | Nowak Michael | $200,000 | |
| Closed | Nowak Michael | $167,000 | |
| Closed | Nowak Michael | $100,000 | |
| Closed | Nowak Michael | $168,000 | |
| Closed | Nowak Michael | $168,000 | |
| Previous Owner | Nowak Michael | $175,000 |
Source: Public Records
Tax History Compared to Growth
Tax History
| Year | Tax Paid | Tax Assessment Tax Assessment Total Assessment is a certain percentage of the fair market value that is determined by local assessors to be the total taxable value of land and additions on the property. | Land | Improvement |
|---|---|---|---|---|
| 2024 | $7,610 | $521,752 | $191,594 | $330,158 |
| 2023 | $7,610 | $511,523 | $187,838 | $323,685 |
| 2022 | $7,382 | $501,494 | $184,155 | $317,339 |
| 2021 | $7,292 | $491,662 | $180,545 | $311,117 |
| 2020 | $7,025 | $486,621 | $178,694 | $307,927 |
| 2019 | $7,148 | $477,081 | $175,191 | $301,890 |
| 2018 | $7,065 | $467,727 | $171,756 | $295,971 |
| 2017 | $6,965 | $458,557 | $168,389 | $290,168 |
| 2016 | $5,742 | $449,567 | $165,088 | $284,479 |
| 2015 | $5,668 | $442,815 | $162,609 | $280,206 |
| 2014 | $5,275 | $434,142 | $159,424 | $274,718 |
Source: Public Records
Map
Nearby Homes
- 1141 Green Oaks Dr Unit 1
- 1039 Bayview Heights Dr
- 2245 2255 Bayview Heights Dr
- 1210 Bayview Heights Dr
- 0 Vista Del Osos
- 1264 Vista Del Osos
- 915 Highland Dr
- 2120 10th St
- 1595 Los Osos Valley Rd Unit 6B
- 2038 Mountain View Dr
- 2050 9th St
- 781 Los Osos Valley Rd
- 2021 9th St
- 1935 12th St
- 1701 Los Osos Valley Rd Unit 18
- 1912 8th St
- 1231 10th St
- 1266 10th St
- 508 Woodland Dr
- 633 Ramona Ave Unit 44
- 1260 Green Oaks Dr
- 1250 Green Oaks Dr
- 1265 Green Oaks Dr
- 1240 Green Oaks Dr
- 1333 Las Encinas Dr
- 1255 Green Oaks Dr
- 1230 Green Oaks Dr
- 1330 Las Encinas Dr
- 1235 Del Mar Dr
- 1225 Del Mar Dr
- 1335 Las Encinas Dr
- 1245 Green Oaks Dr
- 1245 Del Mar Dr
- 1210 Green Oaks Dr
- 1215 Del Mar Dr
- 2500 Bay Vista Ln
- 1345 Las Encinas Dr
- 1215 Green Oaks Dr
- 2370 Crest Ave