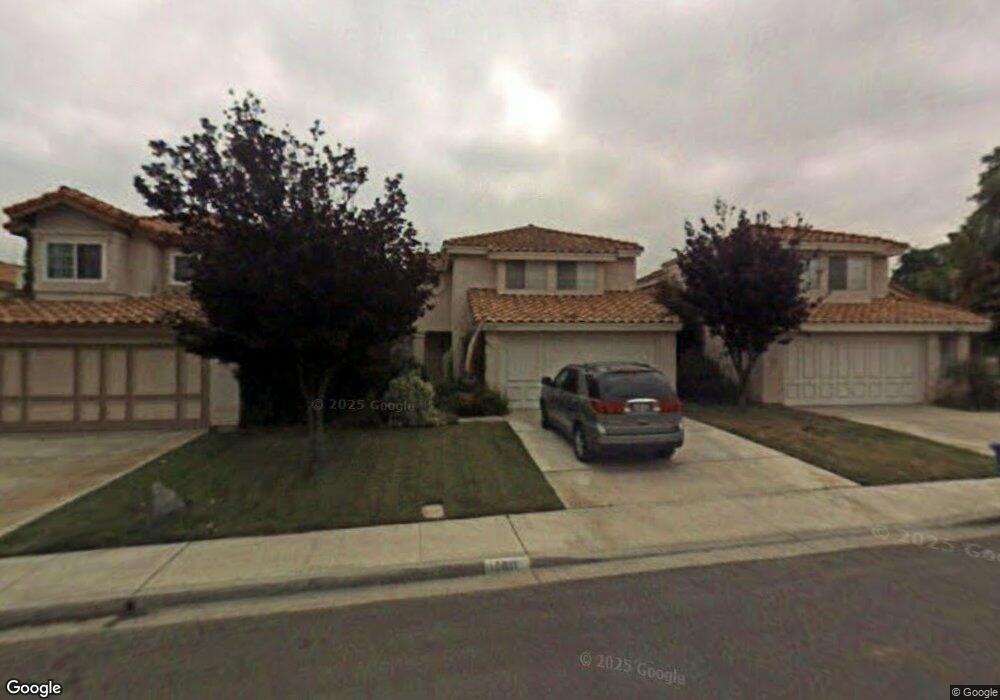
12611 Brickellia St San Diego, CA 92129
Rancho Peñasquitos NeighborhoodEstimated Value: $1,162,000 - $1,472,000
4
Beds
3
Baths
1,822
Sq Ft
$735/Sq Ft
Est. Value
About This Home
This home is located at 12611 Brickellia St, San Diego, CA 92129 and is currently estimated at $1,339,903, approximately $735 per square foot. 12611 Brickellia St is a home located in San Diego County with nearby schools including Park Village Elementary School, Mesa Verde Middle School, and Westview High School.
Ownership History
Date
Name
Owned For
Owner Type
Purchase Details
Closed on
Jul 25, 2012
Sold by
Flohr Robert and Flohr Bonnie
Bought by
Flohr Robert and Flohr Bonnie
Current Estimated Value
Purchase Details
Closed on
May 16, 1996
Sold by
Chen Liang and Hong Bai
Bought by
Flohr Robert and Flohr Bonnie
Home Financials for this Owner
Home Financials are based on the most recent Mortgage that was taken out on this home.
Original Mortgage
$158,400
Outstanding Balance
$9,232
Interest Rate
8.25%
Estimated Equity
$1,330,671
Purchase Details
Closed on
Oct 10, 1994
Sold by
Ardourel Daniel F and Ardourel Kathleen M
Bought by
Liang Chen and Bai Hong
Home Financials for this Owner
Home Financials are based on the most recent Mortgage that was taken out on this home.
Original Mortgage
$180,000
Interest Rate
8.86%
Purchase Details
Closed on
Feb 27, 1986
Create a Home Valuation Report for This Property
The Home Valuation Report is an in-depth analysis detailing your home's value as well as a comparison with similar homes in the area
Home Values in the Area
Average Home Value in this Area
Purchase History
| Date | Buyer | Sale Price | Title Company |
|---|---|---|---|
| Flohr Robert | -- | None Available | |
| Flohr Robert | $198,000 | South Coast Title Company | |
| Liang Chen | $200,000 | First American Title Co | |
| -- | $123,000 | -- |
Source: Public Records
Mortgage History
| Date | Status | Borrower | Loan Amount |
|---|---|---|---|
| Open | Flohr Robert | $158,400 | |
| Previous Owner | Liang Chen | $180,000 |
Source: Public Records
Tax History Compared to Growth
Tax History
| Year | Tax Paid | Tax Assessment Tax Assessment Total Assessment is a certain percentage of the fair market value that is determined by local assessors to be the total taxable value of land and additions on the property. | Land | Improvement |
|---|---|---|---|---|
| 2025 | $3,639 | $328,901 | $87,124 | $241,777 |
| 2024 | $3,639 | $322,453 | $85,416 | $237,037 |
| 2023 | $3,560 | $316,132 | $83,742 | $232,390 |
| 2022 | $3,496 | $309,934 | $82,100 | $227,834 |
| 2021 | $3,449 | $303,858 | $80,491 | $223,367 |
| 2020 | $3,402 | $300,743 | $79,666 | $221,077 |
| 2019 | $3,316 | $294,847 | $78,104 | $216,743 |
| 2018 | $3,230 | $289,067 | $76,573 | $212,494 |
| 2017 | $3,129 | $283,400 | $75,072 | $208,328 |
| 2016 | $3,058 | $277,844 | $73,600 | $204,244 |
| 2015 | $3,000 | $273,672 | $72,495 | $201,177 |
| 2014 | $2,929 | $268,312 | $71,075 | $197,237 |
Source: Public Records
Map
Nearby Homes
- 12573 Brickellia St
- 8695 Rideabout Ln
- 8672 Creekwood Ln
- 12537 Ginger Snap Ct
- 8754 Park Run Rd
- 12518 Darkwood Rd
- 12880 War Horse St
- 12740 Prairie Dog Ave
- 9012 Buckwheat St
- 12776 Isocoma St Unit 4
- 12465 Pathos Ln
- 9068 Buckwheat St
- 12485 Picrus St
- 13146 Thunderhead St
- 9342 Twin Trails Dr Unit 303
- 9302 Twin Trails Dr Unit 204
- 12660 Stella Ln
- 9446 Pipilo St
- 9458 Twin Trails Dr Unit 205
- 9525 Vervain St
- 12619 Brickellia St
- 12603 Brickellia St
- 6886 Rideabout Ln
- 8612 Rideabout Ln
- 12627 Brickellia St
- 12603 Creekwood Ct
- 12602 Creekwood Ct
- 8620 Rideabout Ln
- 12635 Brickellia St
- 12608 Creekwood Ct
- 8628 Rideabout Ln
- 12581 Brickellia St
- 12610 Brickellia St
- 12618 Brickellia St
- 12602 Brickellia St
- 12643 Brickellia St
- 12614 Creekwood Ct
- 12592 Rideabout Ct
- 12626 Brickellia St
- 12596 Brickellia St