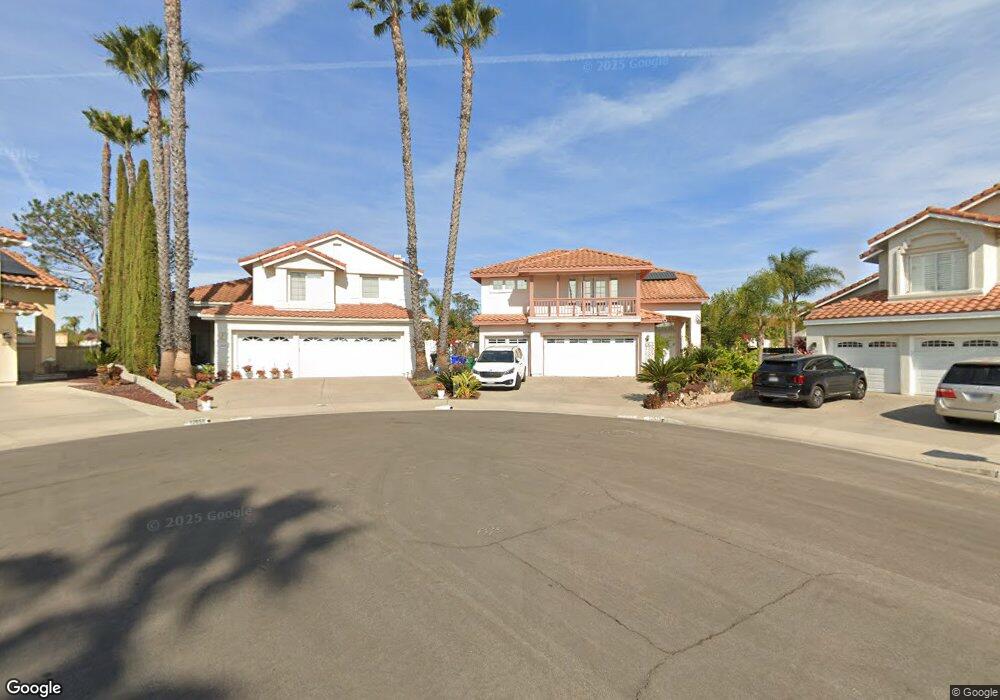
12645 Sora Way San Diego, CA 92129
Rancho Peñasquitos NeighborhoodEstimated Value: $1,837,000 - $2,010,000
5
Beds
3
Baths
2,668
Sq Ft
$730/Sq Ft
Est. Value
About This Home
This home is located at 12645 Sora Way, San Diego, CA 92129 and is currently estimated at $1,946,332, approximately $729 per square foot. 12645 Sora Way is a home located in San Diego County with nearby schools including Park Village Elementary School, Mesa Verde Middle School, and Westview High School.
Ownership History
Date
Name
Owned For
Owner Type
Purchase Details
Closed on
Nov 19, 2021
Sold by
Arumugam Ganesh Ganesh
Bought by
Ganesh A Ganesh And Sivathilaka S Ganesh 2017 and Ganesh Sivathilak
Current Estimated Value
Purchase Details
Closed on
Jul 20, 2017
Sold by
Ganesh Ganesh A and Ganesh Sivathilaka S
Bought by
Ganesh Ganesh A and Ganesh Sivathilaka S
Purchase Details
Closed on
Oct 10, 1997
Sold by
Ganesh and Sivathilaka
Bought by
Ganesh Ganesh A and Ganesh Sivathilaka
Home Financials for this Owner
Home Financials are based on the most recent Mortgage that was taken out on this home.
Original Mortgage
$214,600
Interest Rate
7.49%
Purchase Details
Closed on
May 24, 1995
Sold by
Walch James P and Walch Vicki C
Bought by
Ganesh Arumugam and Ganesh Sivathilaka
Home Financials for this Owner
Home Financials are based on the most recent Mortgage that was taken out on this home.
Original Mortgage
$252,000
Interest Rate
8.36%
Purchase Details
Closed on
Oct 5, 1990
Create a Home Valuation Report for This Property
The Home Valuation Report is an in-depth analysis detailing your home's value as well as a comparison with similar homes in the area
Home Values in the Area
Average Home Value in this Area
Purchase History
| Date | Buyer | Sale Price | Title Company |
|---|---|---|---|
| Ganesh A Ganesh And Sivathilaka S Ganesh 2017 | -- | -- | |
| Ganesh Ganesh A | -- | None Available | |
| Ganesh Ganesh A | -- | Chicago Title Co | |
| Ganesh Arumugam | $315,000 | Commonwealth Land Title Co | |
| -- | $299,400 | -- |
Source: Public Records
Mortgage History
| Date | Status | Borrower | Loan Amount |
|---|---|---|---|
| Previous Owner | Ganesh Ganesh A | $214,600 | |
| Previous Owner | Ganesh Arumugam | $252,000 |
Source: Public Records
Tax History Compared to Growth
Tax History
| Year | Tax Paid | Tax Assessment Tax Assessment Total Assessment is a certain percentage of the fair market value that is determined by local assessors to be the total taxable value of land and additions on the property. | Land | Improvement |
|---|---|---|---|---|
| 2025 | $5,524 | $529,076 | $185,636 | $343,440 |
| 2024 | $5,524 | $518,703 | $181,997 | $336,706 |
| 2023 | $5,400 | $508,533 | $178,429 | $330,104 |
| 2022 | $5,324 | $498,563 | $174,931 | $323,632 |
| 2021 | $5,231 | $488,788 | $171,501 | $317,287 |
| 2020 | $5,171 | $483,777 | $169,743 | $314,034 |
| 2019 | $5,056 | $474,292 | $166,415 | $307,877 |
| 2018 | $4,948 | $464,993 | $163,152 | $301,841 |
| 2017 | $4,814 | $455,876 | $159,953 | $295,923 |
| 2016 | $4,739 | $446,938 | $156,817 | $290,121 |
| 2015 | $4,657 | $440,226 | $154,462 | $285,764 |
| 2014 | $5,499 | $431,604 | $151,437 | $280,167 |
Source: Public Records
Map
Nearby Homes
- 12518 Darkwood Rd
- 12573 Brickellia St
- 12465 Pathos Ln
- 12537 Ginger Snap Ct
- 8695 Rideabout Ln
- 12485 Picrus St
- 8672 Creekwood Ln
- 9012 Buckwheat St
- 8754 Park Run Rd
- 9068 Buckwheat St
- 12740 Prairie Dog Ave
- 13146 Thunderhead St
- 12660 Stella Ln
- 11598 Alkaid Dr
- 9342 Twin Trails Dr Unit 303
- 9302 Twin Trails Dr Unit 204
- 8761 Menkar Rd
- 9525 Vervain St
- 9368 Babauta Rd Unit 93
- 11940 Black Mountain Rd Unit 41
- 12639 Sora Way
- 12655 Sora Way
- 12498 Brickellia St
- 12494 Brickellia St
- 12635 Sora Way
- 12486 Brickellia St
- 12656 Sora Way
- 12625 Sora Way
- 12646 Sora Way
- 12636 Sora Way
- 12474 Brickellia St
- 12626 Sora Way
- 12464 Brickellia St
- 8610 Rumex Ln
- 8606 Rumex Ln
- 12616 Sora Way
- 12694 Picrus St
- 12695 Picrus St
- 12454 Brickellia St
- 12485 Brickellia St